Key Takeaways
Sonic saw a surge in price following an inflow of over $23 million in TVL and positive chain netflows. However, the potential for a sustained boom does not fully align with the recent gains.
In the past day, Sonic [S] emerged as one of the market’s top performers, posting a 10% gain—a sharp turnaround from the 17% drop it had recorded earlier.
AMBCrypto analysis found that while the broader market remains bullish, sentiment across key metrics is not in full alignment, leaving room for a possible decline. Here’s how the situation could play out.
S: Liquidity grows
The Total Value Locked (TVL), which gauges investor confidence in an asset, has taken a major shift as investors adopt a long-term outlook.
Over the past day, this group of investors added $21.05 million worth of S into protocols on the Sonic chain, according to DeFiLlama.


Source: DeFiLlama
This inflow suggests that the funds have been locked, a sign that the dominant sentiment leans toward long-term price appreciation.
Additionally, chain netflow data, which measures liquidity moving in and out of the network, shows that investors bridged assets from other chains into Sonic to acquire its native token.
As of now, $832,000 worth of S has been added to the chain, solidifying its liquidity position at current levels.
On-chain activity doesn’t tally
On-chain activity does not match Sonic’s recent price gains. At the time of the rally, both Active Addresses and Daily Transactions on the chain declined.
Active Addresses typically indicate broader network usage and rising utility for a token, which often correlates with demand.

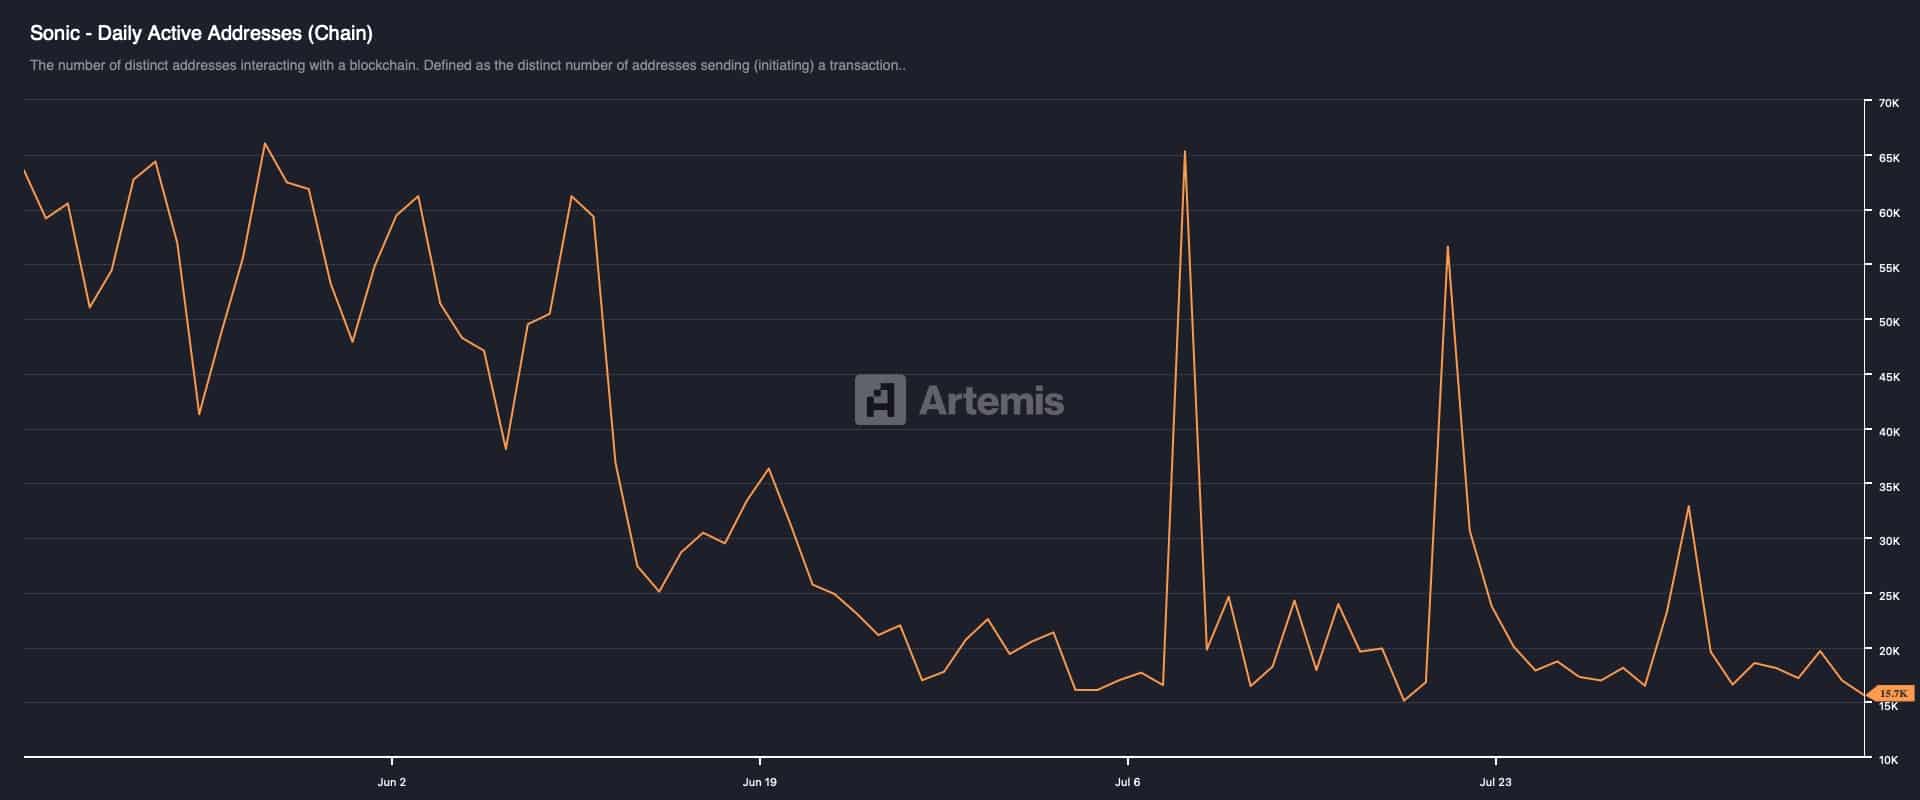
Source: Artemis
Currently, the number of active addresses has dropped to 15,700—just 500 addresses away from the yearly low of 15,200, a level that previously coincided with a price decline.
Similarly, Daily Transactions have fallen. At the time of writing, transactions stood at 294,800, confirming that remaining users are engaging less.
There were an average of 18.7 transactions per user, compared to 27.5 per user in May 2023, when price activity surged notably.
Off-chain sentiment remains weak
Off-chain sentiment on centralized exchanges also remains weak. During this period, liquidity movement and momentum behind the rally were minimal.
For context, Sonic’s daily trading volume stood at $6.14 million—a 32% decline.
Historically, a rise in price accompanied by declining volume indicates weak momentum behind a rally, suggesting a potential pullback.


Source: CoinGlass
Open Interest data from CoinGlass further confirms this trend. The total liquidity in derivatives stands at just $23 million, with only $340,000 added in the past day.
Liquidation data shows traders removed less than $200 worth of positions from the market, reflecting weak derivatives sentiment and little interest in Sonic.
If this trend in on-chain and off-chain sentiment continues through the week, Sonic may face a reversal of the gains it recorded over the past day.
Source: https://ambcrypto.com/sonic-rebounds-after-17-drop-yet-network-usage-lags/