- Solana must hold the $141 support. Otherwise, a further drop could test $120.
- Short positions dominated with $78.42 million, exceeding longs by over $24 million.
Solana [SOL] continued to drift sideways near $147, recording just a 0.25% uptick in the last 24 hours.
But under this seemingly calm surface, traders and analysts are firing off conflicting predictions—from sharp drops to wild rallies.
Solana chart patterns spook traders
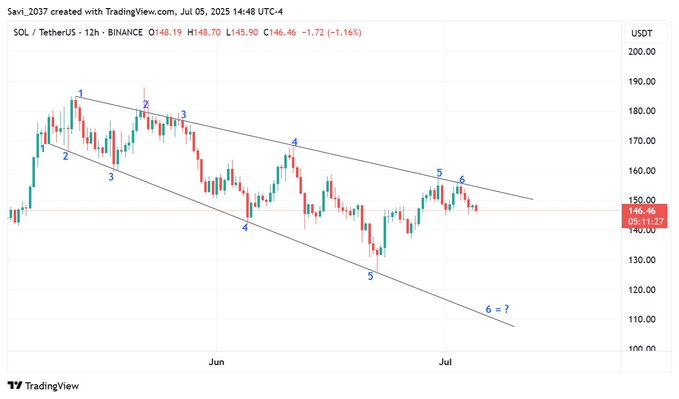
On X, a crypto expert flagged a descending broadening wedge on the 12-hour chart, labeling the setup as –
“$SOL Chart Looking Very Scary.”
According to the pattern, a breakdown toward the $120–$125 zone is possible if selling pressure accelerates.

Source: X (Formerly Twitter)
Meanwhile, another expert shared a post, stating that SOL’s long-term growth potential is massive. The post noted that the long-term price target ranges from $169 to $420 per SOL.
As mixed calls poured in, sentiment wavered, fueling both hope and hesitation across the market.
Solana’s volume vanished?
According to CoinMarketCap, 24-hour trading volume collapsed by over 47%, a clear signal that traders were stepping aside.
This sharp drop in participation came as SOL hovered around the $147 mark, caught in a period of low-volatility indecision.
Such a decline often reflects uncertainty. Without a directional move, many traders prefer to wait it out, especially when the broader structure lacks a strong trend.
AMBCrypto’s technical analysis observed that SOL is at a make-or-break point, as it appears to be struggling at a key support level of $145.
This ongoing price consolidation has been observed on SOL’s daily chart following the breakout from a descending channel pattern.


Source: TradingView
If SOL breaks below $141, the drop could extend to $120. Conversely, a daily close above $160 could reignite bullish momentum and drive a push toward $183.
$4.26 million worth of SOL sent to exchanges
Data from Spot Inflow/Outflow revealed that, amid the ongoing market uncertainty, exchanges have recorded an inflow of $4.26 million worth of SOL in the past 24 hours.


Source: CoinGlass
This substantial inflow suggests a potential dump and may indicate that investors and long-term holders are preparing to safeguard their assets in case the price dips further.
$78 million in bearish bets
Not only investors, but traders have also been leaning toward a bearish outlook.
At press time, they were over-leveraged around $145.1 on the lower side (support) and $149.5 on the upper side (resistance).


Source: CoinGlass
Within that range, short positions reached $78.42 million, sharply outpacing the $53.97 million in longs.
This indicates that interest in short positions is significantly higher than in long positions, reflecting a strong bearish sentiment toward SOL.
Source: https://ambcrypto.com/solana-chart-looking-very-scary-at-147-a-plunge-can-take-sol-down-to/