The Shiba Inu price today is hovering near $0.00001173, reflecting a modest uptick after holding key support near $0.00001150. This recovery follows a period of extended downside pressure where bulls have finally begun showing signs of life. With fresh technical signals flashing across multiple timeframes, traders are watching closely to assess whether a short-term reversal is now taking shape or if this is just another lower high in a broader bearish trend.
What’s Happening With Shiba Inu’s Price?
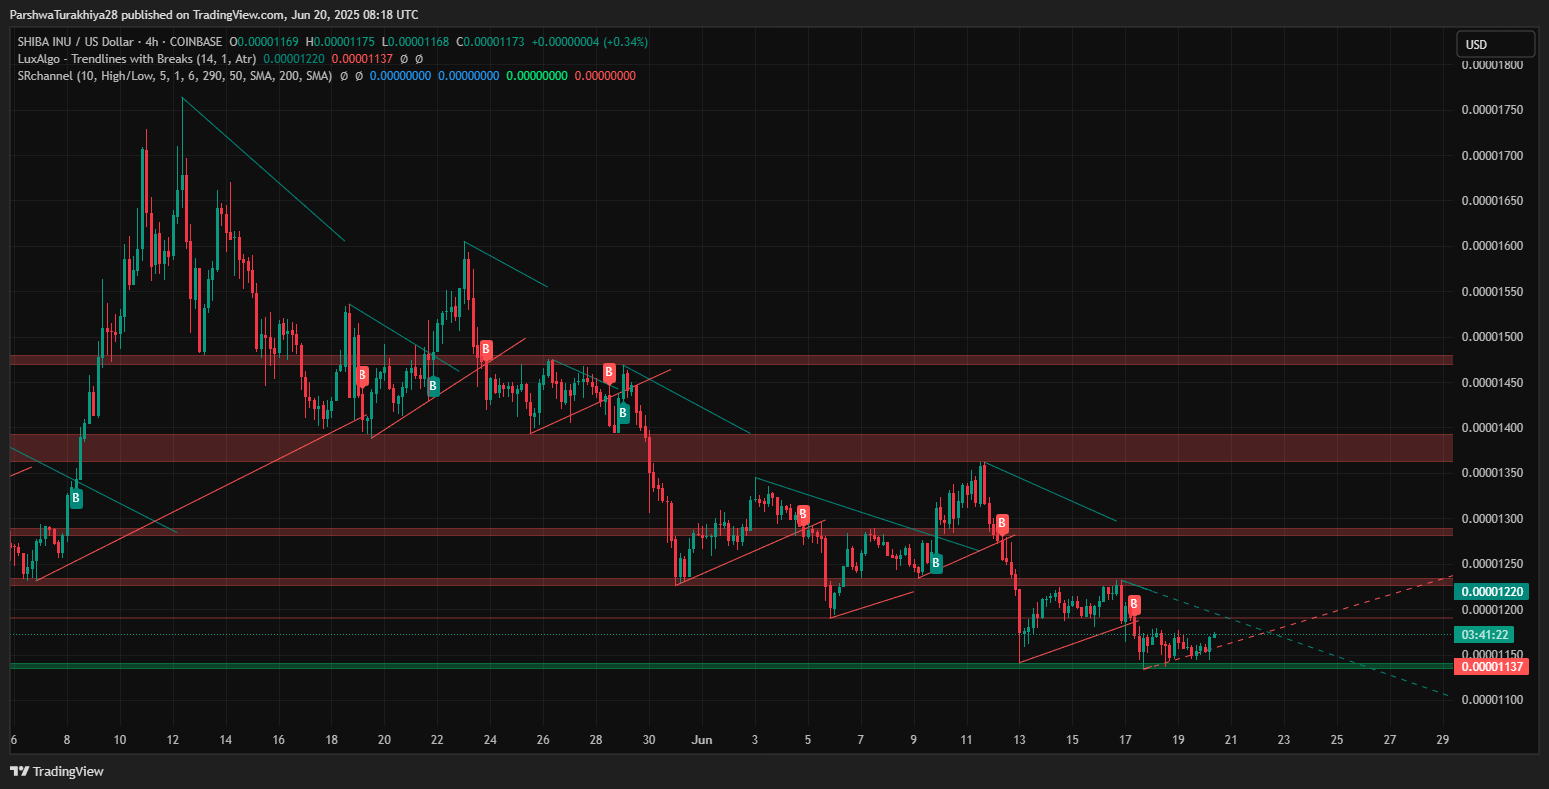

Over the past week, the Shiba Inu price has traded in a tight range between $0.00001140 and $0.00001190, with bears unable to extend losses below the $0.00001130 zone. On the 4-hour chart, a falling wedge pattern is nearing resolution, with SHIB attempting to break above the short-term descending trendline.
Despite persistent lower highs since mid-June, price has now formed a series of higher lows around a firm demand area, suggesting early accumulation. The 200 EMA at $0.00001286 remains a key upside hurdle, but the presence of multiple failed breakdowns hints at buyer strength building below.
Why Shiba Inu Price Going Up Today?
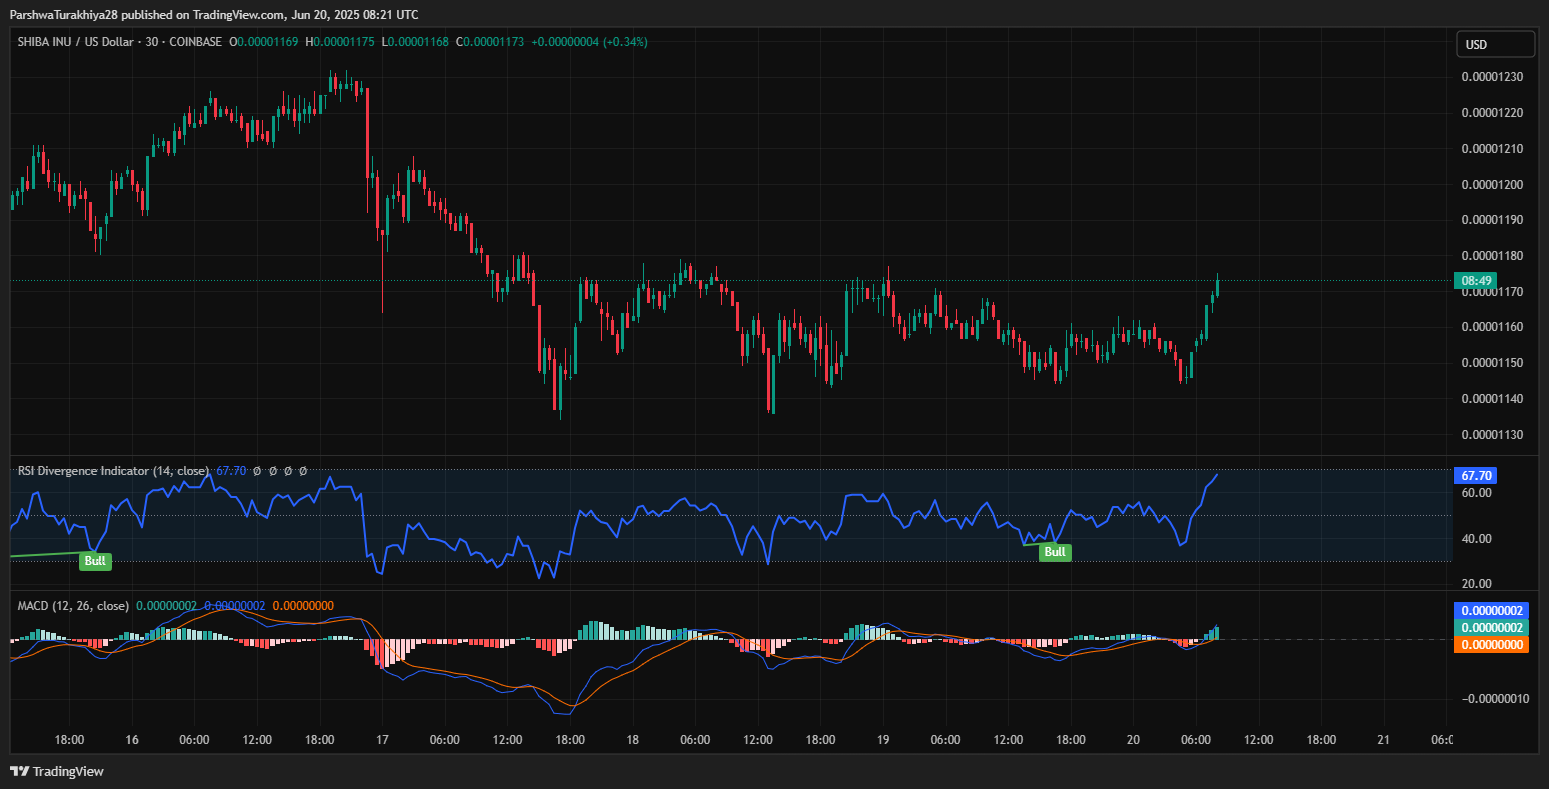
The Shiba Inu price going up today can be attributed to a confluence of technical and on-chain factors. First, RSI divergence on the 30-minute chart broke out decisively, with the RSI jumping to 67.70 as price cleared minor consolidation. Simultaneously, the MACD flipped bullish, and Supertrend on the 30-minute frame turned green — confirming a shift in near-term momentum.
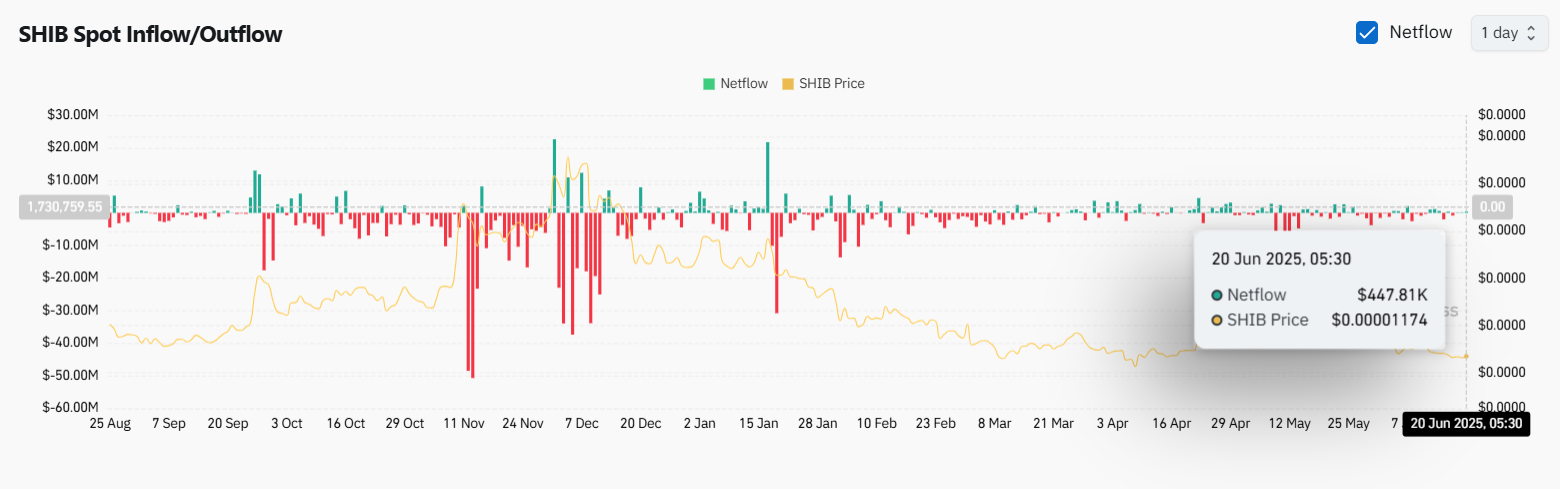
On-chain, the SHIB spot exchange netflow for June 20 turned slightly positive (+$447.81K), suggesting a mild uptick in exchange deposits. While not significant in size, this shift points to cautious repositioning, as some holders may be preparing to sell into strength or test resistance zones.
Shiba Inu Price Prediction: Bollinger Bands and EMA Compression Set the Stage
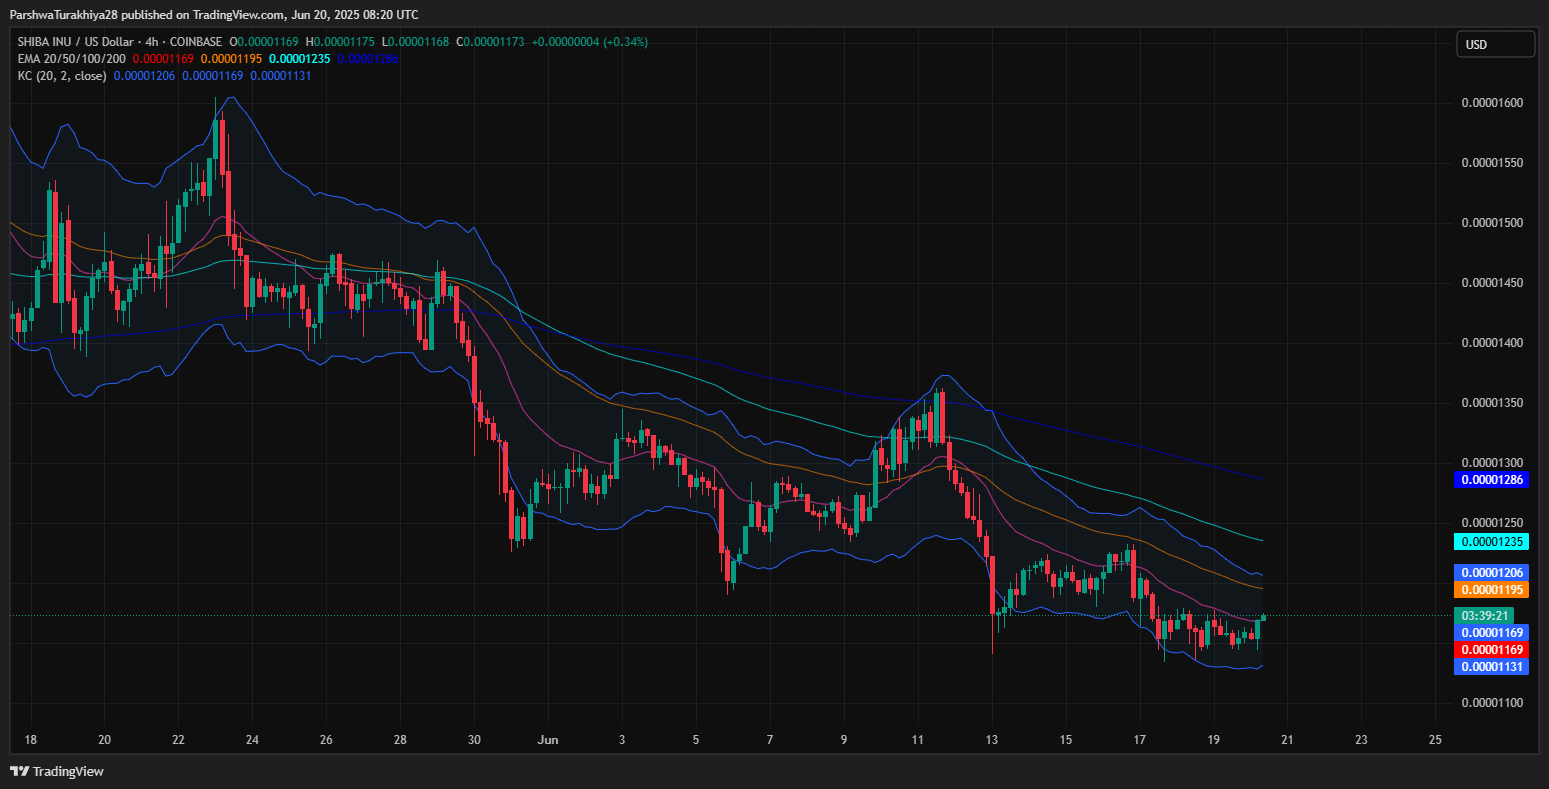
Bollinger Bands on the 4-hour chart have begun to tighten significantly, with the upper and lower bands at $0.00001235 and $0.00001131 respectively. This narrowing volatility suggests that a larger breakout move could be approaching. Notably, price is now pressing against the mid-band ($0.00001195), which is also aligned with the 50 EMA.
SHIB remains below its 100 EMA ($0.00001206) and 200 EMA ($0.00001286), but the clustering of the 20/50 EMAs between $0.00001169 and $0.00001195 is a critical zone. If bulls can reclaim and hold above $0.00001200, a retest of $0.00001235–$0.00001260 is likely.
Shiba Inu Price: Smart Money Accumulation and Liquidity Zones

The smart money concept chart shows SHIB bouncing from a weak low liquidity region near $0.00001120. This zone has acted as a magnet for accumulation throughout June, and the recent bullish CHoCH (Change of Character) signals near this level strengthen the case for short-term upside.
On the upside, SHIB faces supply zones between $0.00001260 and $0.00001340, where previous breakdowns occurred. A clean break above this zone, especially if supported by rising volume, could open up room for a larger Shiba Inu price spike toward $0.00001450.
Shiba Inu Price: Volatility Signals From VWAP and SAR
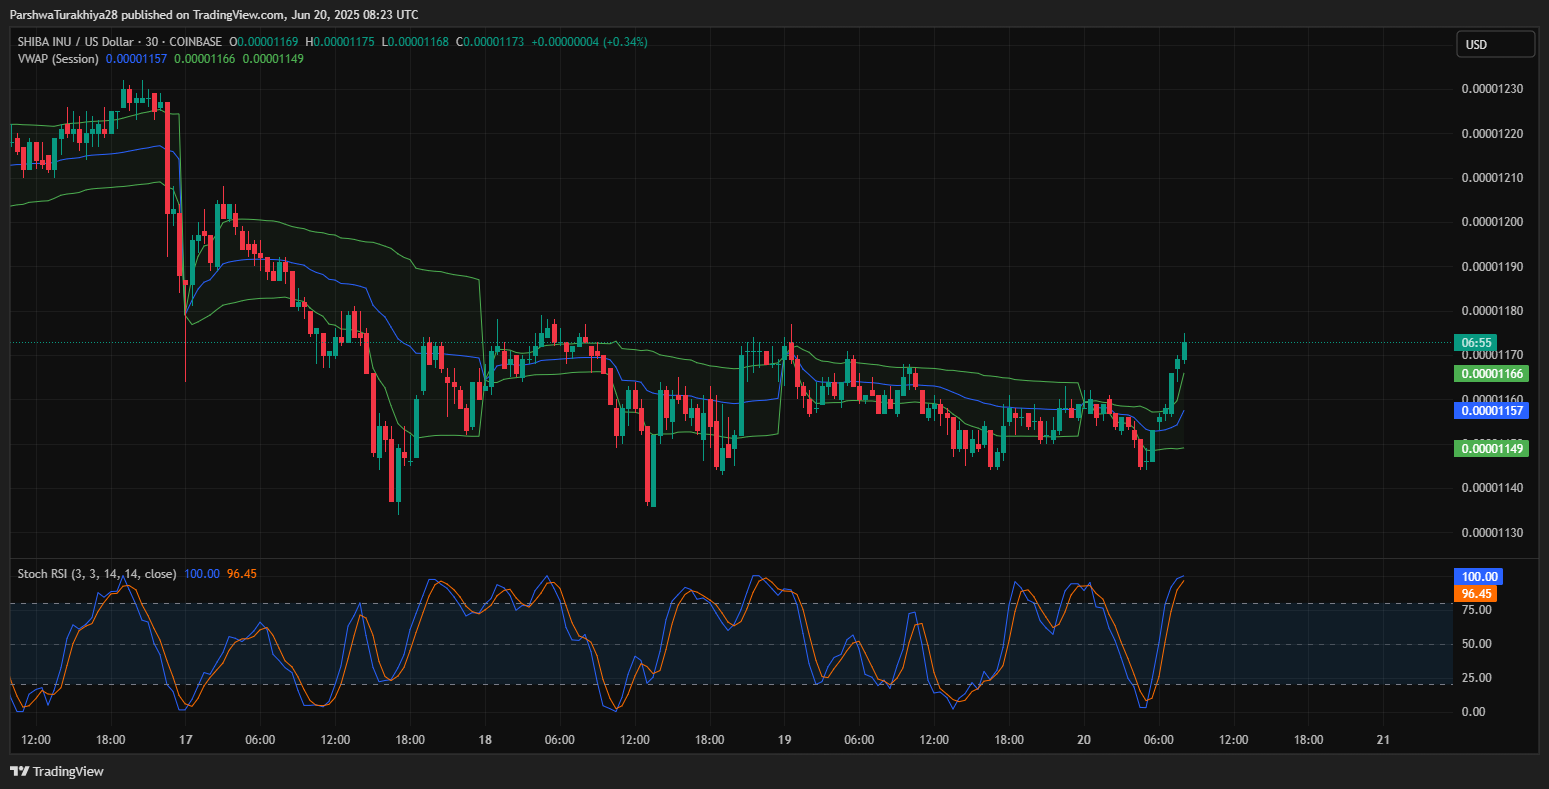
The VWAP indicator on the 30-minute chart now shows SHIB trading above the session mean ($0.00001157), with price recently breaking above the upper VWAP band — a potential indication of emerging bullish control.
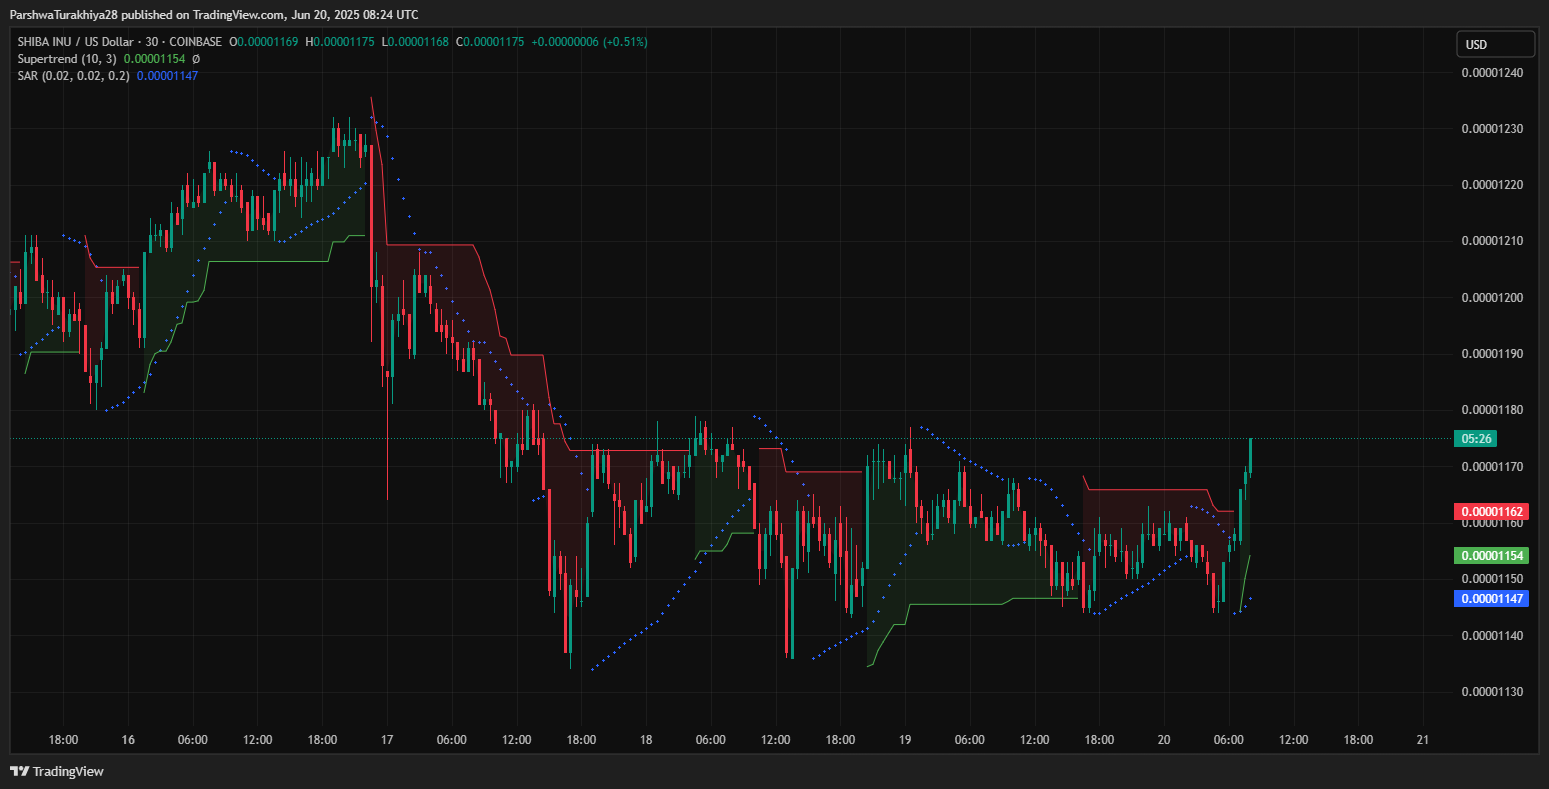
The Parabolic SAR dots have flipped below price for the first time in several sessions, which often precedes trend continuation moves when supported by other metrics.
Shiba Inu Price Short-Term Outlook and Forecast
Momentum indicators are now showing bullish bias. The Stoch RSI has reached the 100 level, reflecting temporary overbought conditions, but this can remain elevated during trend continuations. Price has also reclaimed a key mid-range level, suggesting the next impulse move could be upward.
That said, a sustained move above $0.00001220 is needed to confirm bullish reversal structure. Until then, the Shiba Inu price action remains in a cautiously optimistic posture, with support at $0.00001150 and resistance at $0.00001260.
Shiba Inu Price Technical Forecast Summary for June 21, 2025
| Indicator | Level/Signal |
| Shiba Inu price today | $0.00001173 |
| Immediate Support | $0.00001150 |
| Immediate Resistance | $0.00001220 |
| RSI (30-min) | 67.70 (bullish) |
| MACD | Bullish crossover |
| Supertrend | Bullish (30-min, $0.00001154) |
| Bollinger Band Midline | $0.00001195 |
| VWAP Bias | Trading above mean |
| Smart Money Support | $0.00001120 |
| Upside Target | $0.00001260–$0.00001340 |
While SHIB’s overall trend remains under pressure on the higher timeframes, short-term indicators are starting to favor bulls. Traders should monitor for confirmation above the $0.00001220 level and be wary of sharp pullbacks toward the $0.00001130 liquidity floor.
Disclaimer: The information presented in this article is for informational and educational purposes only. The article does not constitute financial advice or advice of any kind. Coin Edition is not responsible for any losses incurred as a result of the utilization of content, products, or services mentioned. Readers are advised to exercise caution before taking any action related to the company.
Source: https://coinedition.com/shiba-inu-shib-price-prediction-for-june-21-2025/