The Shiba Inu price analysis continues to indicate bullish signals for a third consecutive day with a Shooting Star pattern emerging on the daily price chart.
Since the dramatic rise on July 06 2022, when SHIB’s price jumped to $0.00001039 before continuing its ascent to $0.0001160, the bearish thesis has been invalidated to a new bullish trend.
Shiba Technical analysis
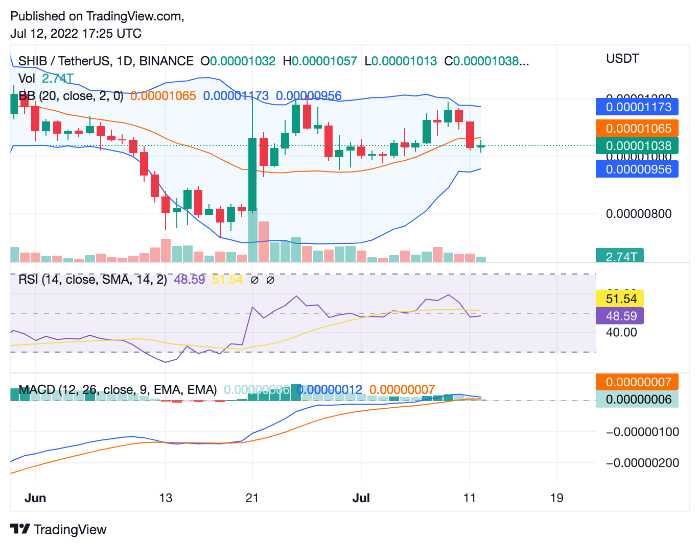
The Bollinger bands signify that Shiba is bullish as the price is trading well above the lower Bollinger band.
The RSI indicator is also in the bullish range as it is currently at 48.59. The RSI indicator is nearing 65 the overbought zone an indication that the market is currently on the bullish trend.
The MACD indicator shows a bullish crossover as the signal line is almost crossing over the MACD line which indicates that Shiba Inu might be entering a period of bullish momentum in the market.
The bulls are trying to push the price up as it is forming a higher high pattern. The bears are not able to push the prices down as it keeps testing the $0.00001000 resistance level.
A breakout of this resistance level might see Shiba Inu test the $0.00002000 psychological level in the near-term.
The 4-hour timeframe is currently showing a bullish trend as the price is trading. The price action for Shiba Inu in the past 4 hours has been showing an increase in price as it breakout of the descending triangle pattern.
The price is currently trading at $0.00001044with an increase of 0.03%. The next resistance level is at $0.00001070 and if the price can breakout of this level, we might see Shiba continue its journey to $0.00001200.
The support levels are at $0.00001000 and $0.00000980
Shiba Inu: should you buy or sell this week
Shiba Inu has been on a tear the past few days as it surged in price. The market is currently in a bullish momentum and we might see the prices continue to move higher in the near-term.
The current market conditions are favorable for buyers as the technical indicators are signaling a bullish trend. The RSI indicator is in the bullish range and the MACD indicator is showing a bullish crossover.
From a technical standpoint, it might be a good idea to buy Shiba Inu this week as the market is showing signs of further bullish momentum.
Was this writing helpful?
Source: https://coinpedia.org/price-analysis/shiba-inu-price-analysis-heres-what-next-for-shib-price/