Ethereum (ETH) price showed strength despite Bitcoin’s brief pullback on Monday. Is this faux strength, or will the ETH price continue to ascend? A closer look at technical analysis and on-chain data indicates clear signs of exhaustion and a potential crash to $2,000.
Sell Signs Flash as Ethereum Price Rally Stalls Below $3,000
At press time, Ethereum trades at $2,638 and is up 3.10% today. Due to the recent uptick, the market cap of ETH hovers around $318 billion.
Sell Signal 1: Bearish Divergence Hints $2,000 Retest Likely
On the daily chart, Ethereum’s price has been trading between $2,323 and $2,738 with signs of bullish exhaustion. While ETH produced almost equal highs in the past two weeks, the momentum indicators like RSI and AO produced lower highs. This non-conformity is termed bearish divergence and hints ETH price is due for a short-term pullback.
The Relative Strength Index (RSI) has recently dropped below the overbought zone. The Awesome Oscillator (AO) indicator is approaching the mean level with declining red histogram bars, noting a decline in momentum, similar to the RSI.
The chances of reversal are also high, considering that Ethereum’s price also tagged the February 22 supply zone, extending from roughly $2,800 to $2,600. In trading terminology, a supply zone refers to an area where a significant spike in sell orders has previously led to a steep correction. A retest of this area often leads to a sharp rejection if the buying pressure is weak.
The key levels to watch if Ethereum price begins its correction here include the weekly bullish breaker, extending from $1,800 to $2,100. A revisit of this level is likely considering the aforementioned bearish divergence.


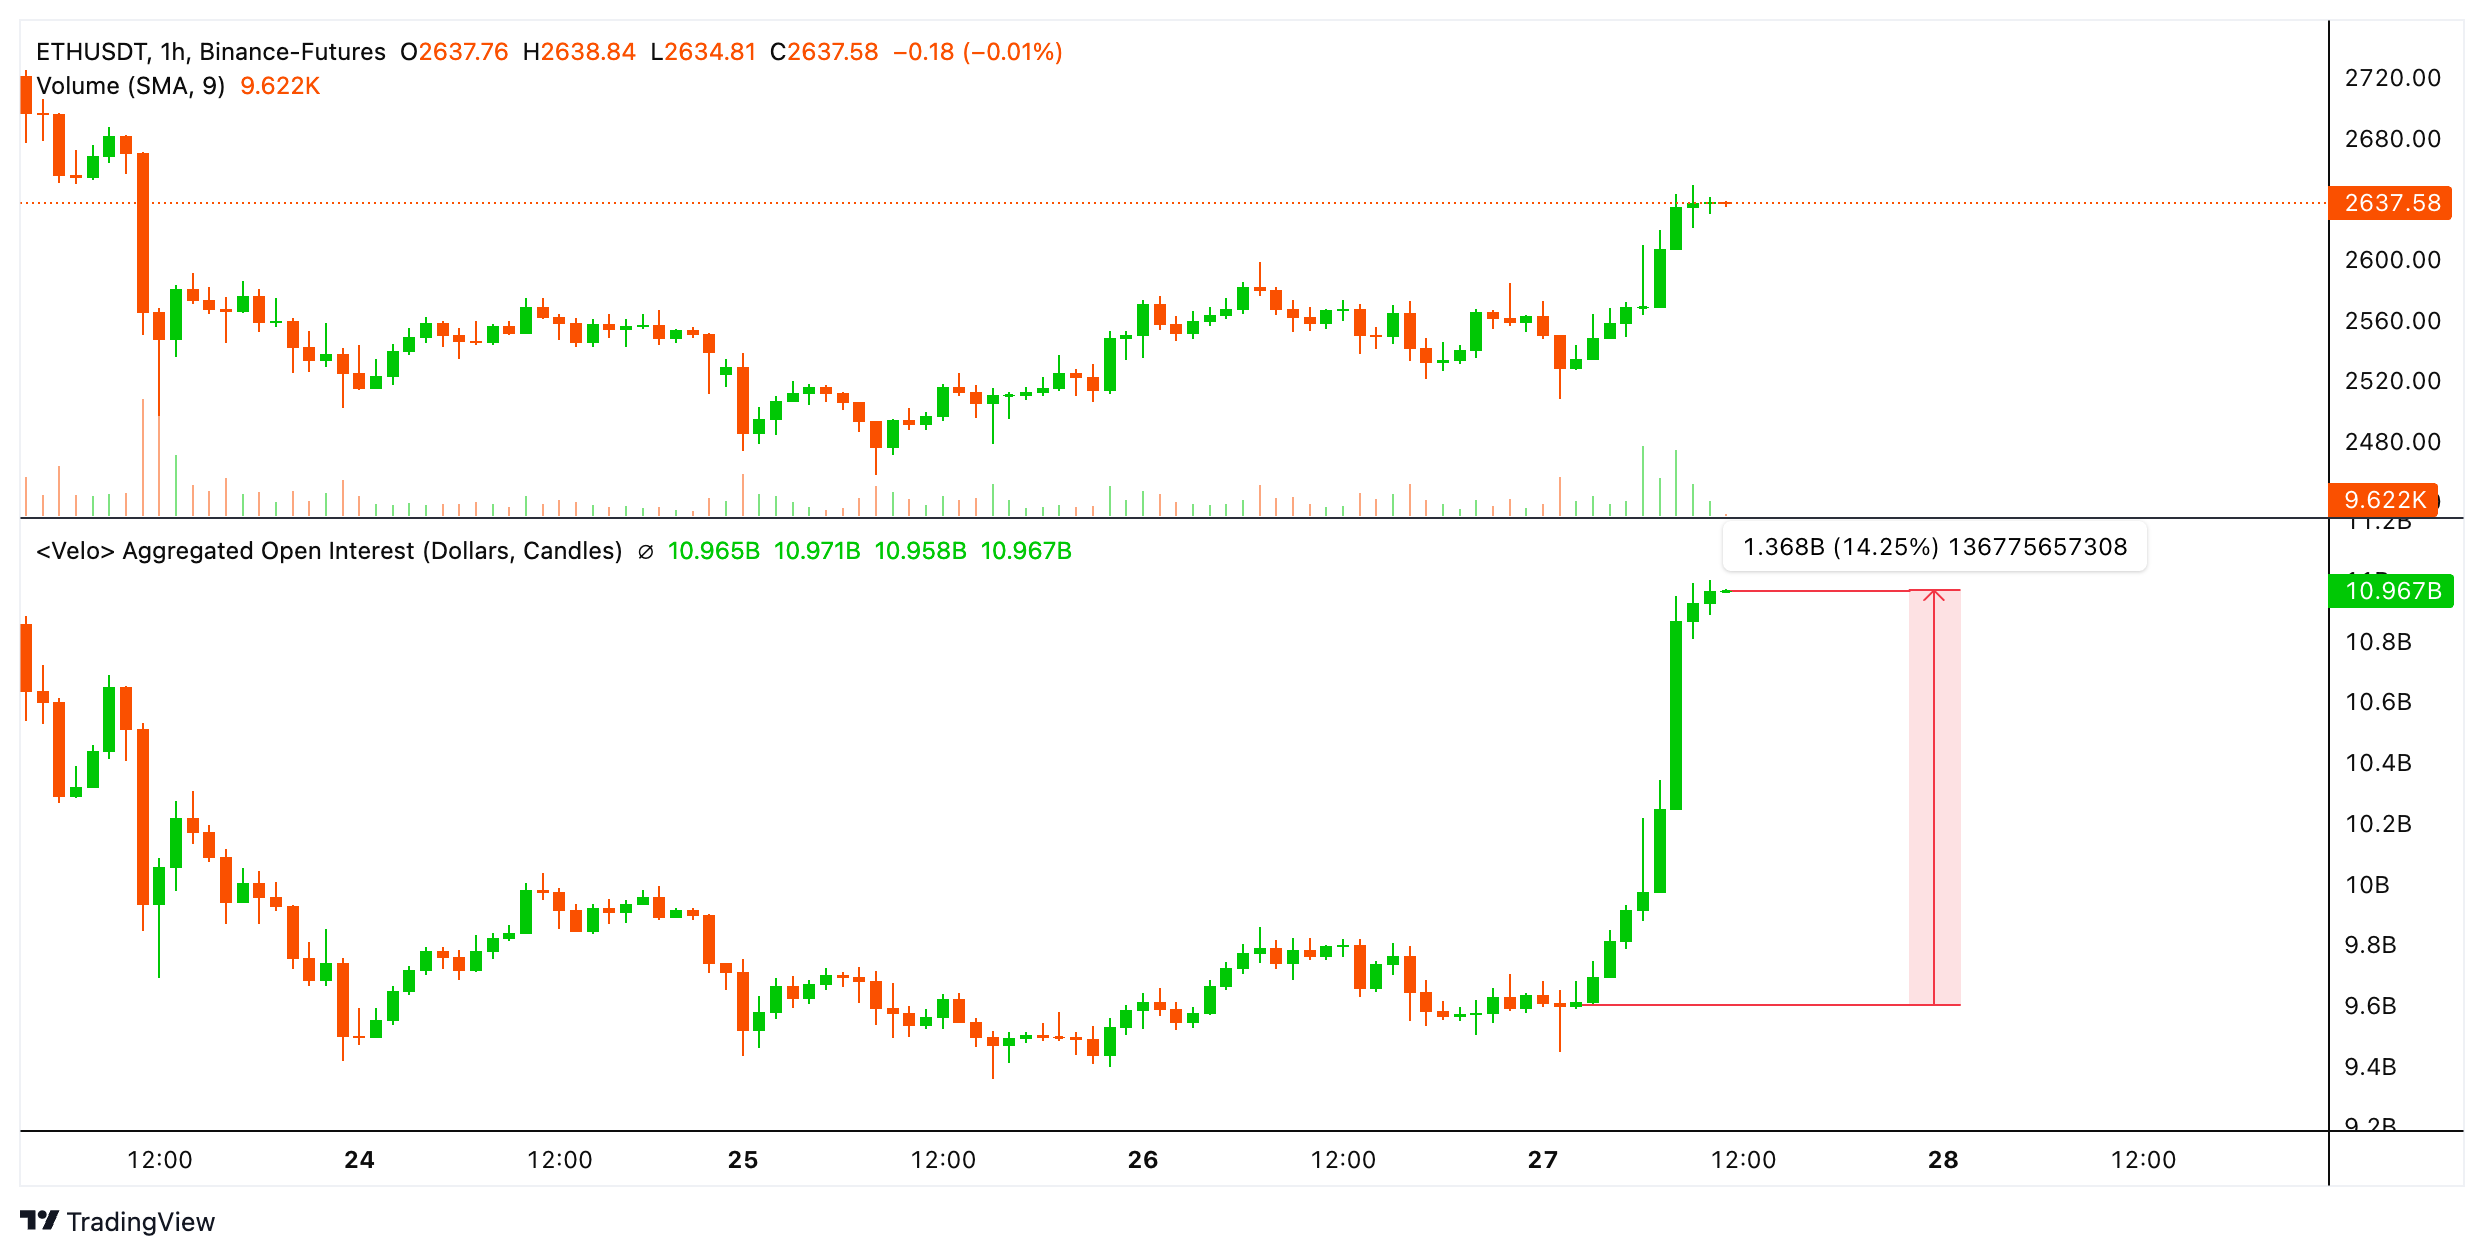
Sell Signal 2: Open Interest Climbs $1.36B, Signals High Leverage
With $3,000 just 13% rally away, the Open Interest (OI) for Ethereum has increased by $1.36 billion in nine hours or less. While OI denotes investor interest, a large spike like the one seen in the past nine hours is a clear sign of leverage. This uptick in OI shows increased leverage in the system.
Typically, when leverage is ramped up at such a rate, markets often tend to reverse to cull eager participants. Hence, the second sell signal also indicates that a drop in Ethereum price is highly likely.

Sell Signal 3: Profit-taking Likely to Trigger Correction
Santiment’s 30-day MVRV Ratio (Market Value to Realized Value) reads 24%, which is the average unrealized profit of ETH investors who purchased a month ago. Typically, spikes into the 10% to 20% ‘danger zone’ territory often lead to reversals as these investors book profits.
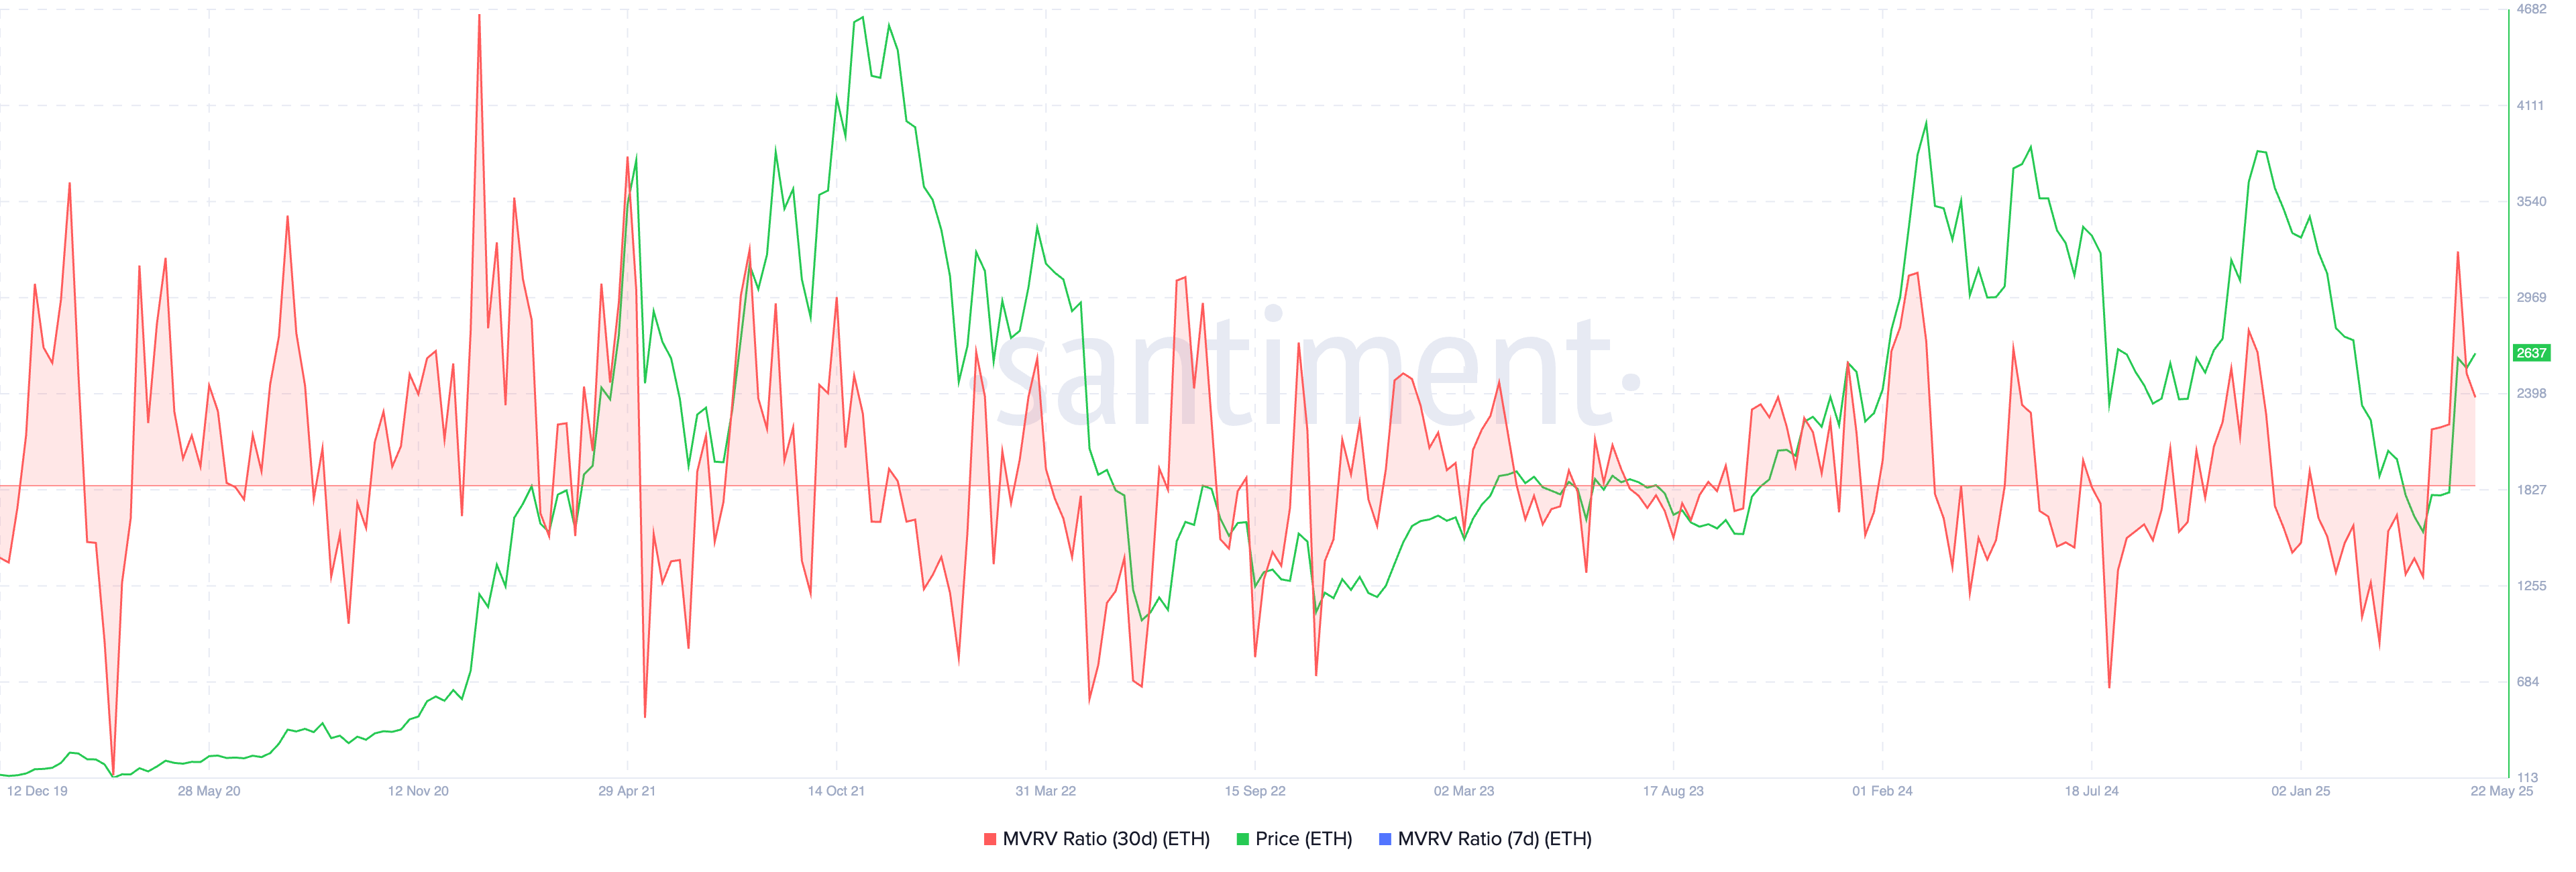

To conclude, the short-term profit-taking potential, coupled with a significant increase in Open Interest, suggests an overextended and overleveraged move for Ethereum price. These two indicators lend credence to the bearish divergence noted on the daily chart, which hints at a correction to the next key support level of $2,000.
For a long-term price prediction of Ethereum 2030-2050: Read This
Frequently Asked Questions (FAQs)
Ethereum trades at $2,638, up 3.10% today, with a market cap of $318 billion.
There are three sell signals: bearish divergence on the daily chart, a surge in Open Interest indicating high leverage, and profit-taking potential based on the 30-day MVRV Ratio.
A potential support level to watch is $2,000, with other key levels including the weekly bullish breaker extending from $1,800 to $2,100.
Akash Girimath
Senior Cryptocurrency Analyst & Market Strategist
Engineer-turned-analyst Akash Girimath delivers data-driven insights on cryptocurrency markets, DeFi, and blockchain technology for platforms like AMBCrypto and FXStreet. Specializing in technical analysis, on-chain analytics, and risk management, he empowers institutional investors and retail traders to navigate market volatility and regulatory shifts.
A hands-on strategist, Akash merges active crypto portfolio management with research on Web3, NFTs, and tokenomics. At AMBCrypto, he led cross-functional teams to redesign content frameworks, achieving record-breaking traffic growth through scalable editorial strategies. His analyses dissect market sentiment, investment strategies, and price predictions, blending macroeconomic trends with real-world trading expertise.
Known for mentoring analysts and optimizing workflows for high-impact reporting, Akash’s work is cited across global crypto publications, reaching 500k+ monthly readers. Follow his insights on YouTube, X, and LinkedIn for cutting-edge perspectives on decentralized ecosystems and crypto innovation.
Disclaimer: The presented content may include the personal opinion of the author and is subject to market condition. Do your market research before investing in cryptocurrencies. The author or the publication does not hold any responsibility for your personal financial loss.
Source: https://coingape.com/markets/ethereum-price-forecast-sell-signals-multiply-hint-correction-to-2000/
✓ Share: