The price of Quant (QNT) is in a sideways trend and is falling below the moving average lines.
Long-term forecast for the Quant price: ranging
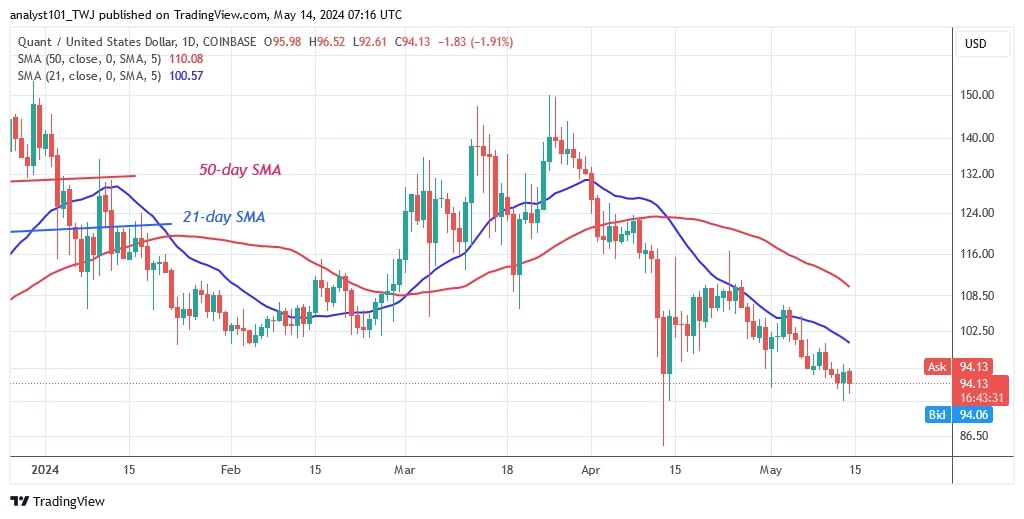
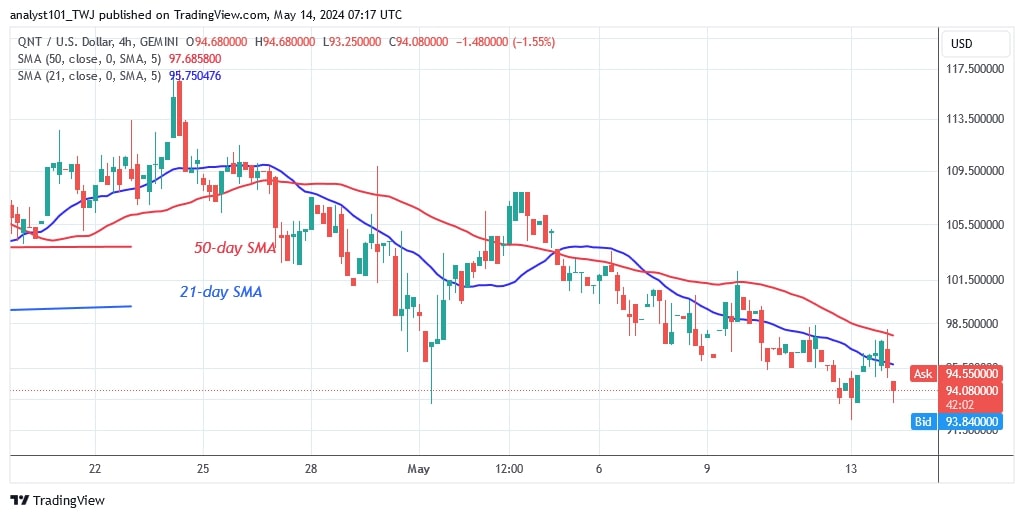
The bulls have already stopped the decline above the $91.50 support level while the price continues its sideways trend. In previous price action, the bears broke through the critical support at $100, which is now a resistance level or the 21-day SMA. QNT is currently in a downtrend and reached a low of $94.
If the bears breach the $91.50 support level, the market would fall back to its previous low of $85. However, if the bulls can hold the $91.50 level, the sideways trend will continue.
Analysis of the quant price indicator
Quant is bearish as the price bars are rejected at the 21-day SMA. The moving average lines are trending south and reaching the bottom of the chart. On May 13, a long candlestick tail indicates strong buying pressure at lower prices.
Technical indicators
Important supply zones: $140, $150, $160
Important demand zones: $90, $80, $70

What is the next move for Quant?
Quant is likely to come under further selling pressure if the current support level of $91.50 is broken. The downward momentum has continued and retested the existing support level of $91.50. If the downtrend continues further south, the cryptocurrency will return to its previous lows at the bottom of the chart.

Disclaimer. This analysis and forecast are the personal opinions of the author and are not a recommendation to buy or sell cryptocurrency and should not be viewed as an endorsement by CoinIdol.com. Readers should do their research before investing in funds.
Source: https://coinidol.com/quant-loses-important-support/
