- PEPE’s OBV indicator at 1,827.73T revealed hidden strength despite price decline
- Critical price level at $0.000002000 could trigger relief rally to $0.000002500 if breached
The cryptocurrency market has seen some remarkable volatility in the memecoin sector lately, with PEPE recording a notable downtrend too. While skeptics have pointed to weakening momentum, technical indicators alluded to the possibility of a trend reversal at press time.
Hence, it’s worth looking at PEPE’s price action, while examining key technical levels and market structure to understand whether a comeback is on or not.
PEPE’s price action shows signs of weakness
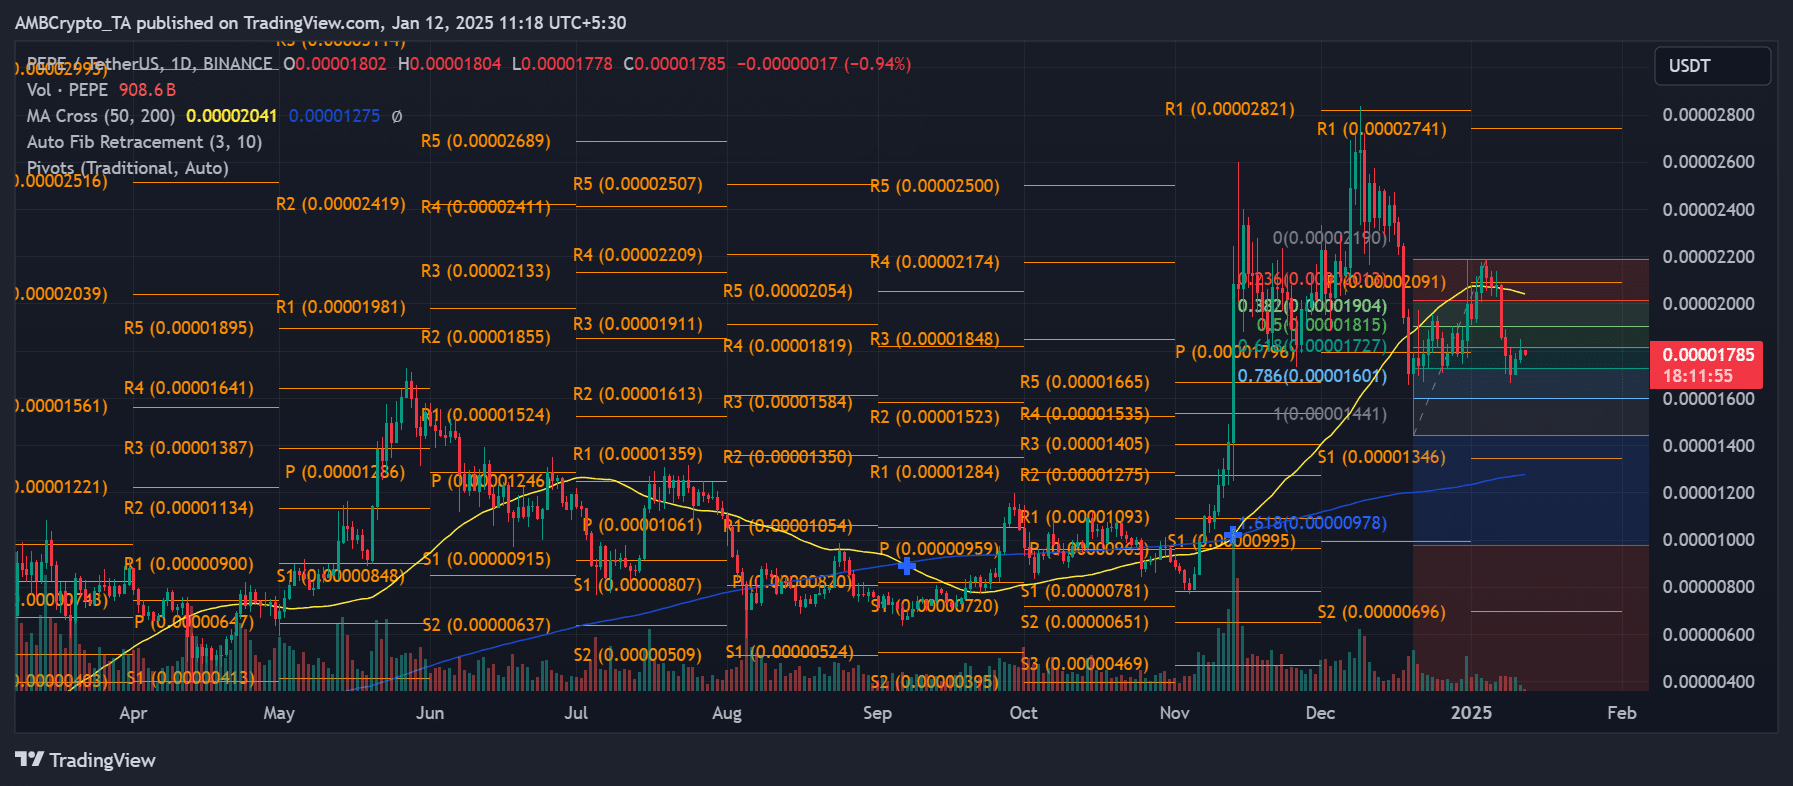
The popular memecoin PEPE hit a critical juncture after experiencing significant selling pressure, with the price testing key support levels at press time. Trading at $0.000001785, the memecoin shed nearly 1% of its value in the last 24 hours, prompting traders to eye potential reversal signals.
AMBCrypto’s technical analysis revealed a complex picture for PEPE’s short-term trajectory.


Source: TradingView
The 50-day moving average at $0.000002041 seemed to hover above the 200-day MA at $0.000001275, maintaining a bullish market structure despite recent declines. However, the narrowing gap between these indicators suggested weakening momentum.
Technical indicators paint mixed picture for PEPE
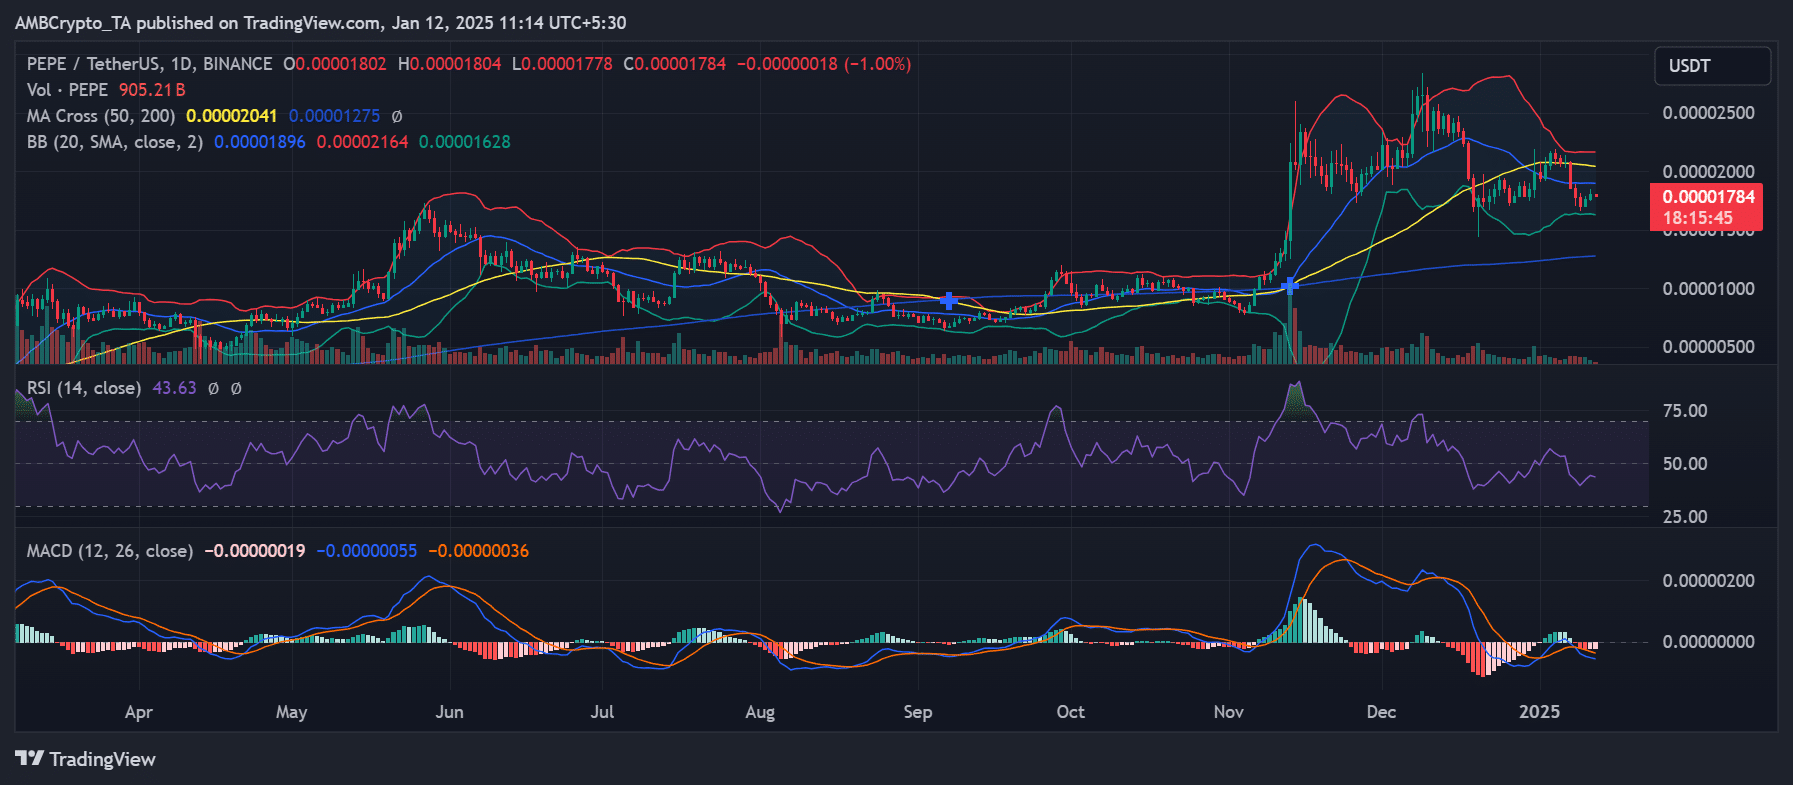
The Relative Strength Index (RSI) sat at 43.63, approaching oversold territory but not yet indicating extreme conditions. This moderate RSI reading leaves room for both further downside and a potential bounce, depending on how market sentiment evolves.


Source: TradingView
PEPE’s price action also formed a series of lower highs since December’s peak, with the Moving Average Convergence Divergence (MACD) histogram underlining a hike in bearish momentum.
The recent crossover of MACD lines into negative territory lends weight to the bearish pressure, though historical patterns suggested these conditions often precede sharp reversals.
PEPE’s volume analysis and market structure
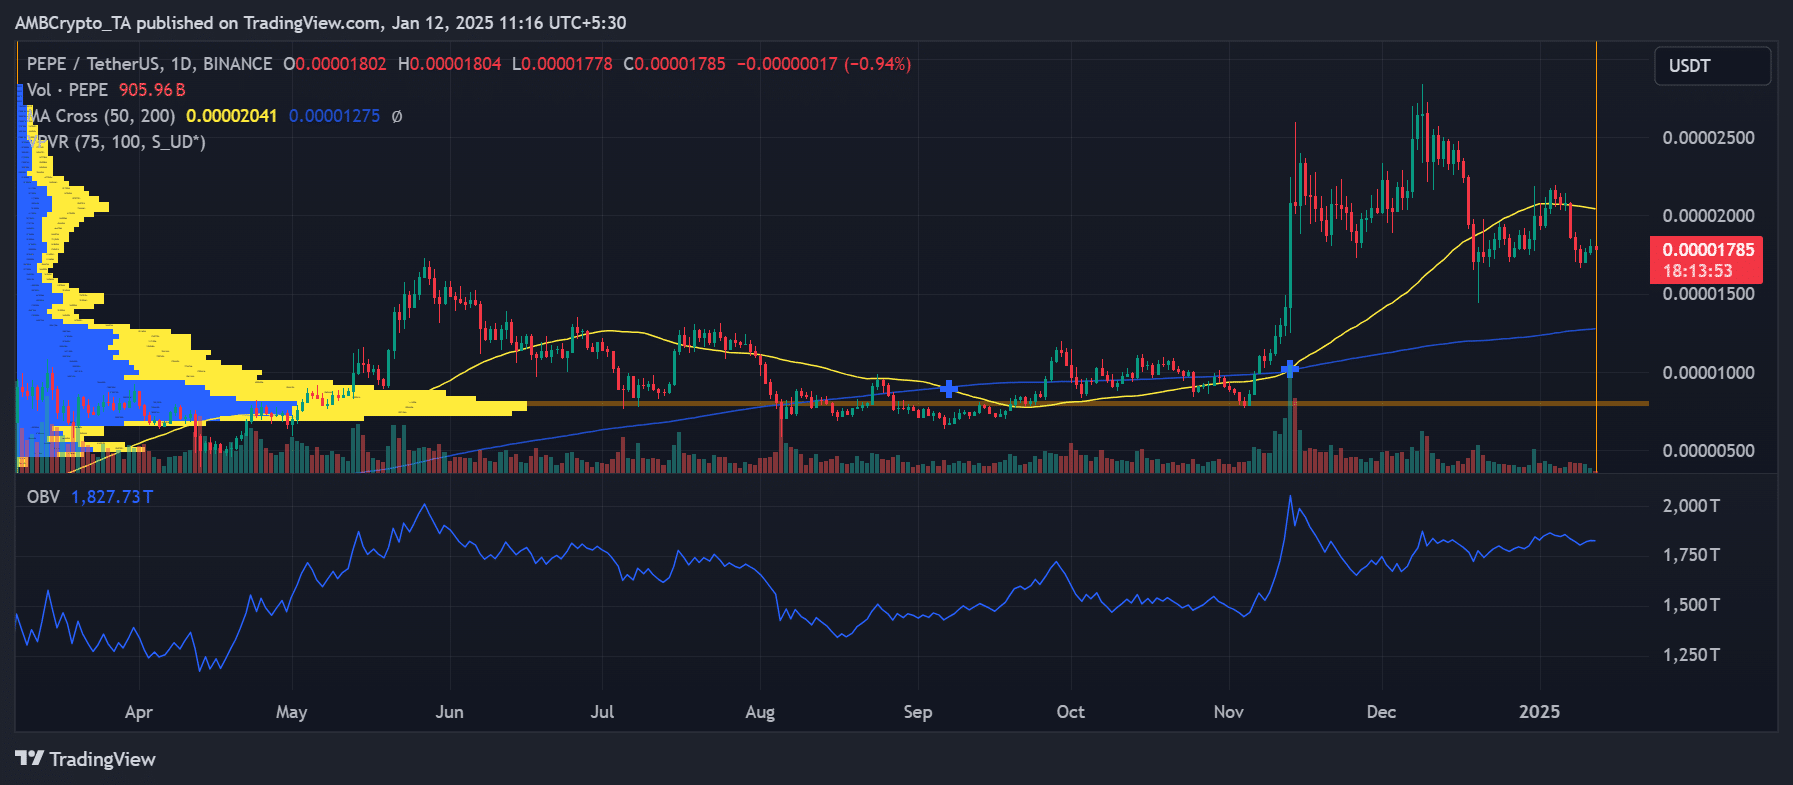
Volume analysis through the On-Balance-Volume (OBV) indicator with a reading of 1,827.73T indicated sustained accumulation, despite price weakness. This divergence between price action and OBV could signal underlying strength not yet reflected in the token’s value.


Source: TradingView
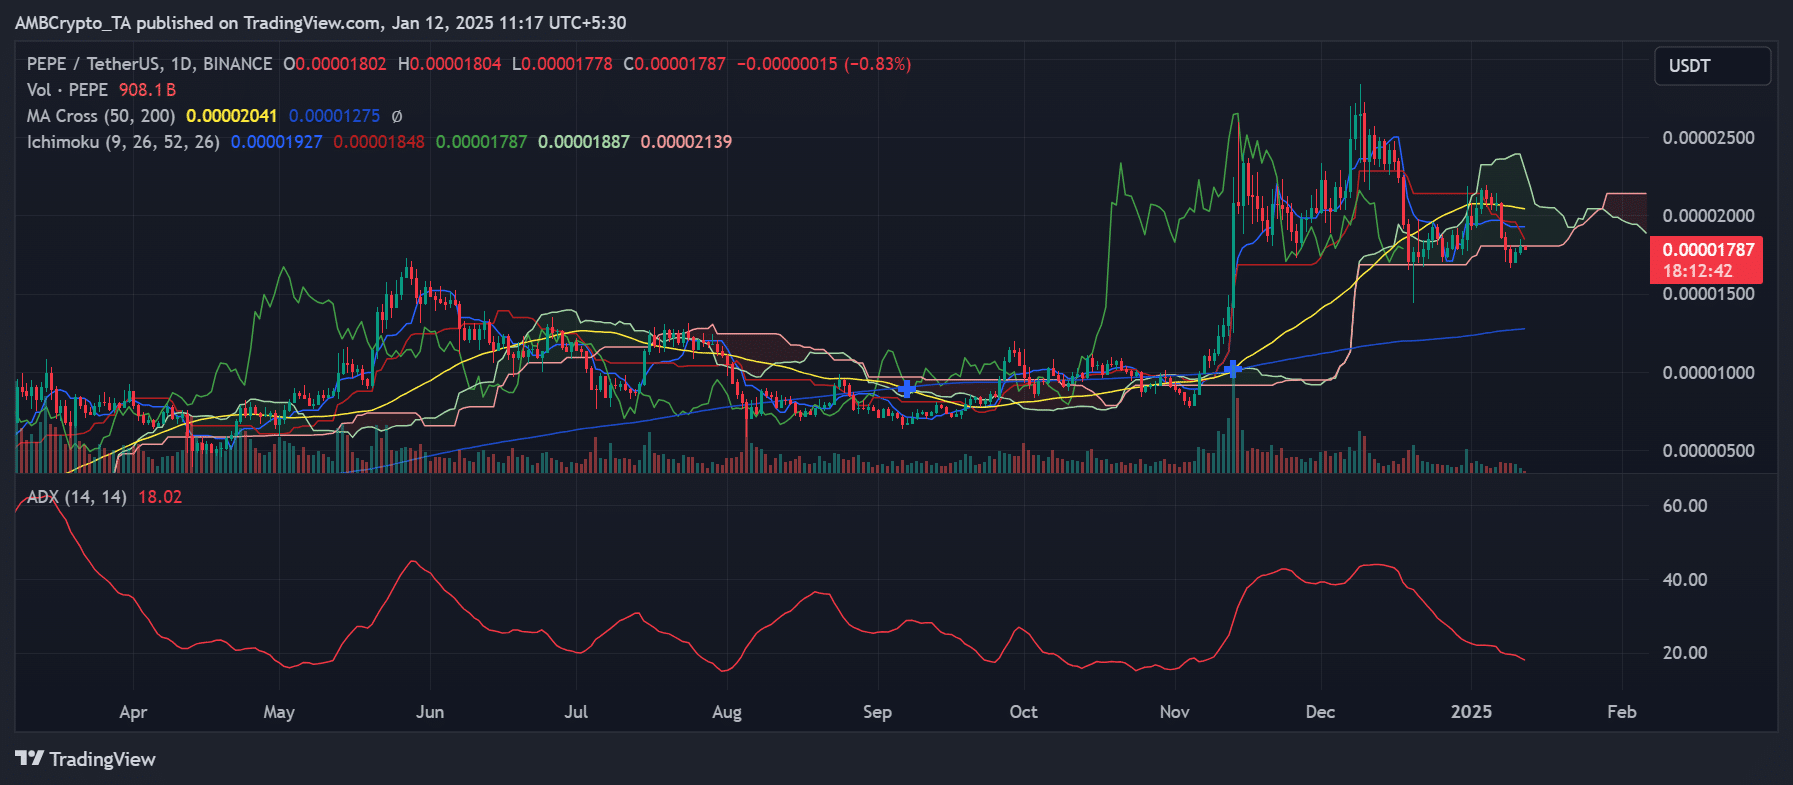
The Ichimoku Cloud formation presented a mixed outlook, with the price testing the cloud’s lower boundary at $0.000001887.
This level has historically served as a dynamic support zone, making it a crucial area for traders to watch.


Source: TradingView
What’s next for PEPE’s price action?
Looking ahead, PEPE faces immediate resistance at $0.000002000, coinciding with the upper Bollinger Band. A decisive break above this level could trigger a relief rally towards the recent high of $0.000002500. Conversely, failure to hold its press time support might result in the price testing the psychological level at $0.000001500.
The Average Directional Index (ADX) reading of 18.02 indicated a weakening trend, suggesting the market might be preparing for a directional shift. Such declining trend strength, combined with compressed Bollinger Bands, often precedes significant price movements.
– Is your portfolio green? Check out the PEPE Profit Calculator
As PEPE approaches this critical support zone, traders should monitor volume patterns and potential reversal signals closely. While technical indicators painted a cautiously bearish picture, the token’s historical volatility suggested that sharp recoveries often follow periods of sustained weakness.
Source: https://ambcrypto.com/pepe-traders-watch-out-for-these-signals-for-a-trend-reversal/