Pantera introduces the new DAT Dashboard, a platform that provides fundamental analysis, sentiment, and issuance discipline to evaluate digital assets with greater transparency.
How Does Pantera’s New DAT Dashboard Work?
In 2025, digital asset tokens (DAT) have entered the mainstream, with a market capitalization among tracked tokens amounting to $117 billion. Many investors have focused solely on mNAV, overlooking the real value drivers.
The new DAT Dashboard by Pantera Capital aims to bridge the gap. It provides insights into token fundamentals, market sentiment, and the management’s issuance discipline.
Breakdown of Growth Drivers
The model breaks down price movements into three components: growth of the underlying crypto activity, crypto held per share (crypto-per-share), and sentiment. This way, it becomes clear whether a token is accumulating real value or merely reacting to market fluctuations.
However, according to Pantera, many declining tokens primarily reflect a deterioration in sentiment, not a worsening of the underlying assets. This distinction helps to avoid confusing market cycles with the structure of fundamentals.
Issuance Discipline and “DAT Flywheel”
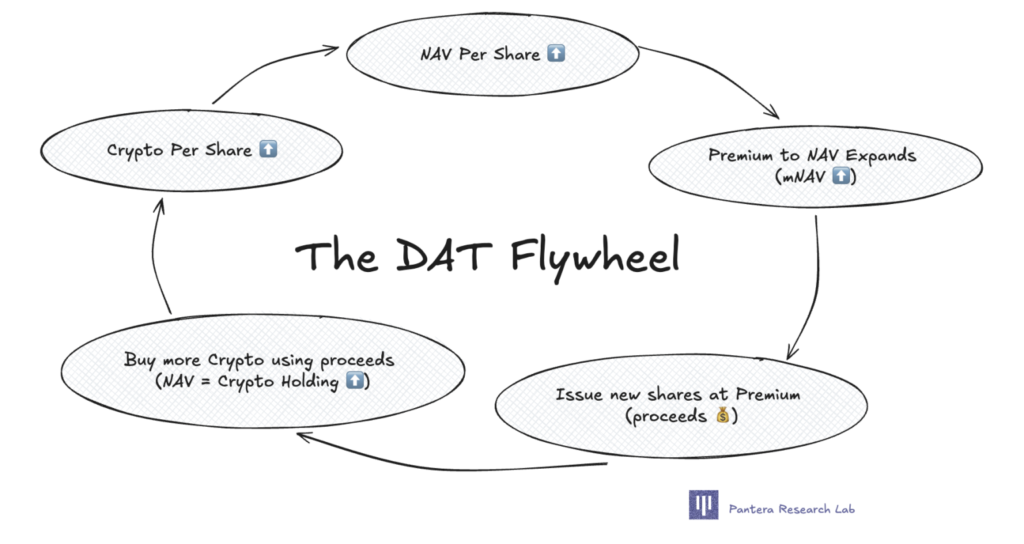
The dashboard also evaluates issuance behaviors, checking if management issues new shares prudently. DATs tend to succeed when capital is raised at a premium, increasing the treasury without diluting current holders.
Moreover, reflexive cycles — the so-called “DAT flywheel” — reward disciplined operators who defend value per share during bear phases. Data shows that entities like Bitmine maintain rigor, while other projects dilute aggressively, weakening long-term sustainability.

What signals are offered on DAT tokens?
By combining fundamental metrics and managerial discipline, the framework evaluates both intrinsic value and treasury strategy. This allows investors to distinguish between DATs that accumulate value and those that are more fragile. Furthermore, Pantera emphasizes the importance of a structured data infrastructure for responsible operations.
Examples: Bitmine, BMNR, and HSDT
To provide consistent comparisons, Pantera tracks 30 main DAT tickers on Bitcoin, Ethereum, and Solana. The breakdown charts show that leading tokens like BMNR and HSDT demonstrate steady growth per share.
That said, underperforming tokens primarily reflect contractions in market sentiment. This reinforces the thesis that mNAV alone is insufficient to accurately evaluate DATs. Investors benefit from visibility into treasury and capital deployment.
Why Are Standards and Transparency Crucial?
Pantera highlights the need for shared reporting standards in the industry. Regular and transparent disclosure allows for monitoring management actions and reducing systemic risks. The dashboard encourages disciplined issuance practices and supports sustainable growth.
Market Implications in 2025
The sector exhibits a power-law distribution: top tokens capture the majority of the market share, while the long tail struggles to defend value or differentiate treasury strategies. However, with solid assets and strategic management, DATs remain a credible financial innovation.
Conclusions and Outlook
Overall, the DAT dashboard provides a standardized lens to separate fundamentals and sentiment, as well as regulate issuance. This can guide investors and operators towards more robust and transparent behaviors, strengthening the maturity of the digital token market.