Key Takeaways
Mantle dropped 8.4% as Daily Active Addresses shrank. Derivatives traders dominated with 69% longs and a positive Funding Rate, while heatmaps flagged both downside risk and rebound potential.
Mantle [MNT] continued to decline in the past day, recording an 8.45% drop in price, falling to $1.14. AMBCrypto’s analysis showed a divide: on-chain metrics looked bearish, but derivatives traders kept adding longs.
On-chain users are exiting
On-chain activity showed that investors are not aligning with the rally, instead choosing to exit the market.
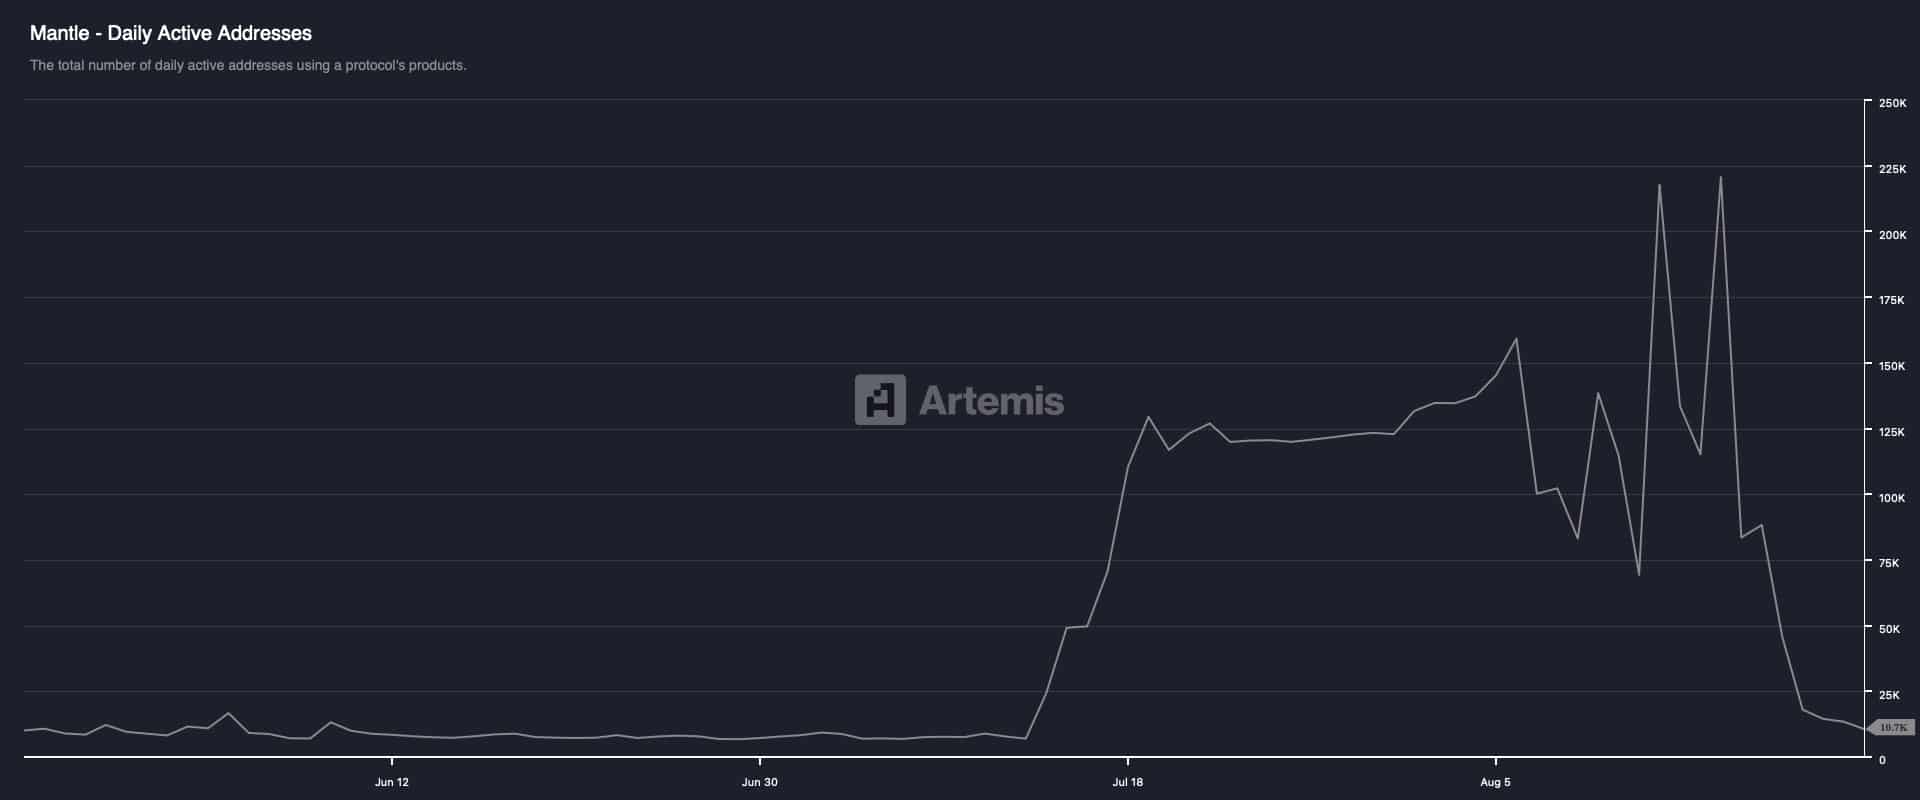
At press time, Daily Active Addresses fell sharply. Artemis data showed active users dropped to 10,700, while daily transactions slid to 199,300. The average transactions per user declined to 18.6.


Source: Artemis
AMBCrypto expects that these figures could shrink further, given the fall in returning users.
Returning users also declined, falling to 9,900 in the past day. This suggests that once users complete their average transactions, the likelihood of them returning is very low.
This overall decline in on-chain metrics signals reduced usage and demand for MNT, which in turn has weighed on price.
Derivatives counter sellers
Derivative traders, however, countered the bearish tone. In the past 24 hours, longs gained dominance.
At press time, 68.9% of trading volume in the derivatives market came from long investors, according to Coinalyze’s Long/Short Ratio.


Source: Coinalyze
The aggregated Funding Rate also turned positive at 0.0078%. On top of that, positive Funding Rates signaled that long traders paid a premium to maintain their positions.
This sentiment usually appears when markets favor longs, hinting at potential upside continuation.


Source: Coinalyze
If bullish leveraged traders maintain this momentum, MNT could gain the upper hand.
Heatmap shows two possible paths
Liquidity clusters on the MNT heatmap revealed that the asset is positioned for both a rally and a decline per CoinGlass.
One scenario pointed to a bearish dip followed by a bullish rebound. Liquidity clusters below $1.14 could be cleared first, turning those levels into demand zones once filled.


Source: CoinGlass
The second possible scenario was a rally upward, with MNT clearing liquidity clusters above its price. However, downside risk remained, as unfilled liquidity clusters still exist below.
Source: https://ambcrypto.com/mantle-active-users-flee-but-this-group-refuses-to-fold/