- 77.7% of Litecoin holders are long-term investors, outpacing Bitcoin and Ethereum’s numbers
- Despite strong HODLing, LTC’s 60-day MVRV was at -12.7% – Sign of poor short-term profitability
Litecoin [LTC] may be enjoying a loyal investor base, but its short-term profitability paints a contrasting picture. Data from IntoTheBlock revealed that 77.7% of all LTC holders are long-term holders [LTH]. In fact, it has the highest percentage of LTH among top assets, including Bitcoin [BTC], Ethereum [ETH], and Shiba Inu [SHIB].
This is a sign of strong conviction in the altcoin’s long-term value. Worth pointing out, however, that recent metrics indicate that these holders may not yet be reaping any significant gains.
A majority of LTC’s supply remains untouched
With over three-quarters of its holders keeping their assets idle for over a year, Litecoin leads the pack in HODLer loyalty. Chainlink [LINK] and SHIB follow closely behind with 77.5% and 75.8%, respectively.
While this points to confidence in LTC’s fundamentals, it also implies low active turnover. This can often suppress short-term demand pressure and limit bullish momentum on the charts.
MVRV confirms Litecoin’s low momentum
This long holding pattern becomes even more relevant when considered alongside the Market Value to Realized Value [MVRV] ratio.
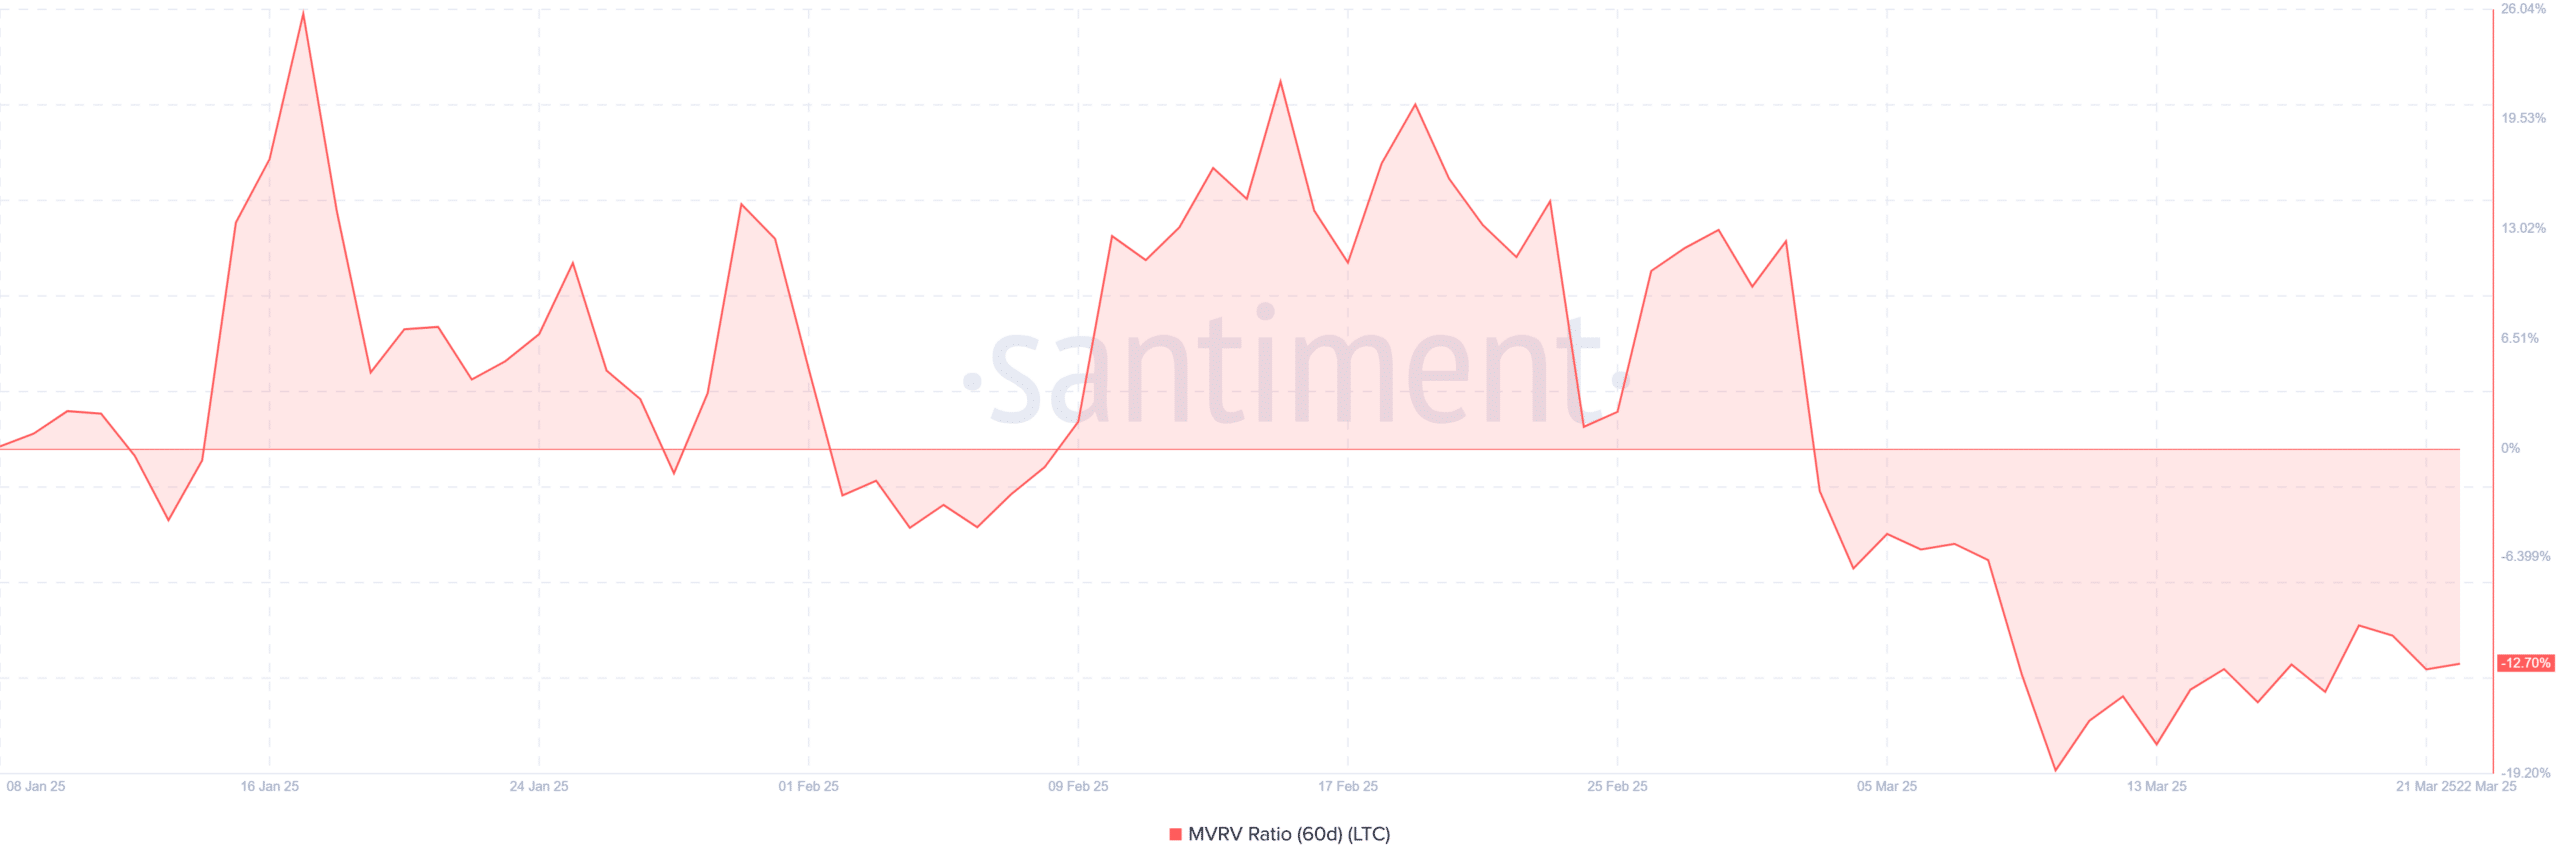

Source: Santiment
Consider this – The 60-day MVRV for LTC had a reading of -12.7% at press time. This signaled that most holders who acquired Litecoin in the last two months are, on average, at a loss.
Negative MVRV values often hint at undervaluation, but they can also indicate a broader market hesitance to buy into ongoing weakness.
Price action highlights a struggle for recovery
On the price charts, Litecoin was valued at $90.98 at the time of writing.
The altcoin seemed to be attempting to reclaim ground lost over the last few weeks. Despite its latest uptick in price, however, the crypto still lagged behind its 50-day [$102.24] and 200-day [$110.95] moving averages.
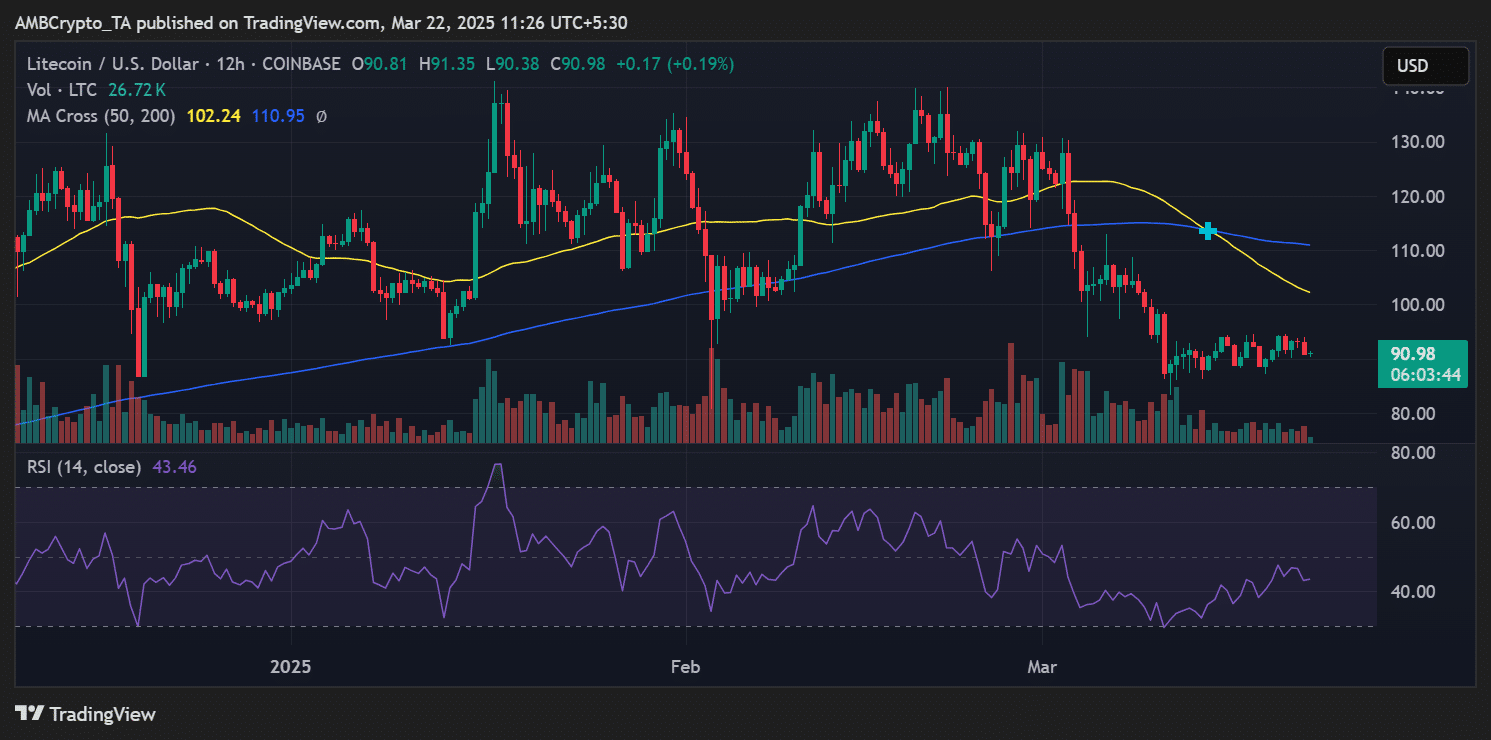

Source: TradingView
RSI was at 43.46, reflecting weakened momentum with no immediate signs of bullish divergence. LTC may remain trapped in a consolidation phase without a decisive break above the $102-resistance.
In summary, while LTC’s high LTH percentage reflects a commitment from its holders, poor profitability and muted price action can be interprested as signs of caution.
If accumulation continues, but the price remains below key moving averages, Litecoin could see extended sideways movement. This, unless broader market sentiment improves or a catalyst sparks demand. Hence, the next few weeks will be interesting to watch.
Source: https://ambcrypto.com/litecoin-tops-hodl-charts-but-traders-arent-exactly-happy-reasons/