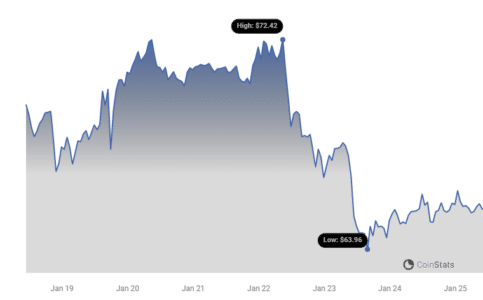
- The price of Litecoin (LTC) started a fresh decline from the $72.00 resistance zone against the US Dollar.
- LTC price is now trading below $68.00 and the 55 simple moving average (4 hours).
- There is a key bearish trend line forming with resistance near $69.00 on the 4-hour chart of the LTC/USD pair (data feed from Coinbase).
- The pair could continue to move down unless the bulls protect the $63.20 support zone.
- Litecoin price is struggling below $70.00 against the US Dollar, like Bitcoin. LTC price could continue to decline if it stays below the $63.20 resistance zone.


In the past few sessions, there was a sharp decline in Bitcoin, Ethereum, Ripple, and Litecoin against the US Dollar. Earlier, LTC struggled to clear the $72.40 resistance and started a fresh decline.
The price broke the $70.00 support zone to enter a bearish zone. The bears even pushed the price below the $65 support zone. It tested the $63.20 zone.
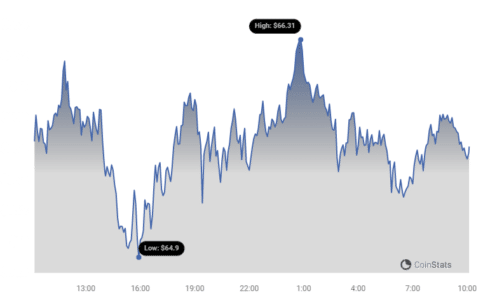

A low has formed near $63.13, and the price is now consolidating losses. It is now trading below $70.00 and the 55 simple moving average (4 hours).
Immediate resistance is near the $67.80 level. It is close to the 50% Fib retracement level of the downward move from the $72.61 swing high to the $63.13 low.
See Also: Price Analysis: SOL Price Recovery May Not Last Unless Solana Clears This Hurdle
The next major resistance is near the $69.00 level or the 61.8% Fib retracement level of the downward move from the $72.61 swing high to the $63.13 low.
There is also a key bearish trend line forming with resistance near $69.00 on the 4-hour chart of the LTC/USD pair.
A clear move above the $69.00 level could pump the price toward the $72.50 level. The next major resistance could be $75.00. On the downside, immediate support is near the $64.25 level.
The next key support is near the $63.20 level. If there is a downside break below the $63.20 support, the price could accelerate lower toward the $60.00 level in the near term.

Looking at the chart, Litecoin price is clearly trading below $70.00 and the 55 simple moving average (4 hours). Overall, the price could continue to move down if it stays below the $69.00 resistance zone.
Technical Indicators
- 4 hours MACD – The MACD for LTC/USD is now losing pace in the bearish zone.
- 4 hours RSI (Relative Strength Index) – The RSI for LTC/USD is now below the 50 level.
- Key Support Levels – $64.25 and $63.20.
- Key Resistance Levels – $67.80 and $69.00.
Source: https://bitcoinworld.co.in/price-analysis-litecoin-ltc-started-a-fresh-decline-aim-for-more-losses-below-60/