Litecoin (LTC) presents a tableau of technical intrigue.
Current analysis points to a potential consolidation phase, setting the stage for a possible bullish reversal that could reshape its trading dynamics.
Litecoin’s 4H Chart Analysis
The 4-hour chart shows Litecoin trading 4% below critical EMAs: the 200-4H at $83 and the 100-day at $82.
The Ichimoku Cloud, or Kumo, complicates things further, with Litecoin recently breaking its lower boundary. This break happened during a broader 10% price drop last Friday, indicating market consolidation and ongoing uncertainty.
LTC also meets significant short-term resistance at the baseline of the four-hour cloud, highlighted in red. This baseline is crucial to watch as it signals potential price reversals. A sustained move above this line suggests a trend towards the EMAs on this 4-hour chart.
A red cloud on the horizon hints at possible bullish momentum, though its current flat look suggests the market is on hold, awaiting a clear direction.
Read More: How To Buy Litecoin (LTC) and Everything You Need To Know
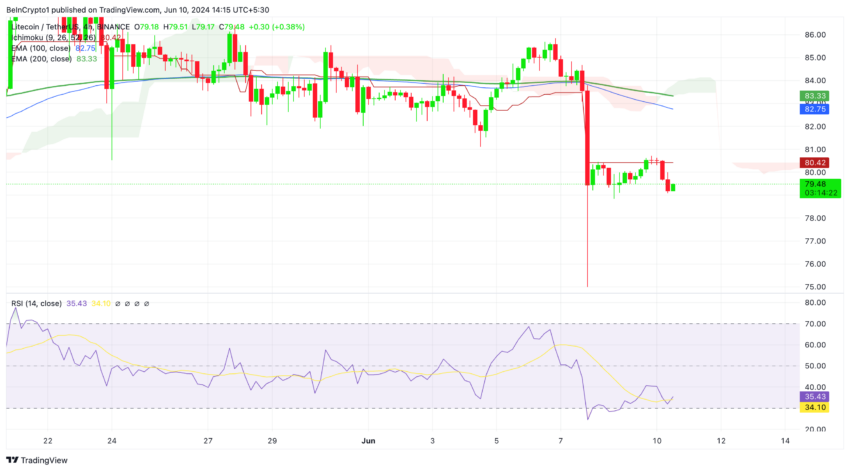
The Relative Strength Index (RSI) on the 4-hour chart is deep in oversold territory at 32. Indicating that the market might currently be undervaluing Litecoin, potentially setting the stage for a bullish recovery.
Litecoin’s Daily Chart Analysis
Litecoin’s struggle to ascend above the cloud on the daily chart suggests a market proceeding with caution, yet traders remain centrally focused on the potential for a breakout.
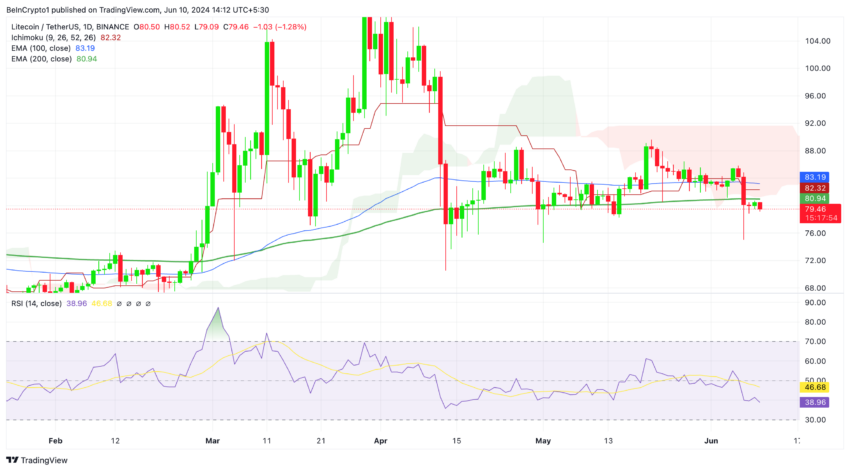
Several attempts to breach the daily Ichimoku Cloud have been met with rejection. Underscoring this area is defined by the cloud as a critical resistance level in the medium term.
LTC consistently trades below both the 100 and 200 EMAs daily.
These two lines and the Ichimoku Cloud serve as significant resistance levels. If Litecoin breaks into the cloud, one of these two levels could halt it.
Should the price successfully surpass both levels, it could signal a continuation of the price movement toward further key resistance levels at $88 and $91.
This condition is mirrored by the daily RSI at 38, which sends a bearish signal that could herald significant market activity.
Surge in Active Litecoin Addresses Signals Potential Uptrend
Active addresses refer to unique wallet addresses that have participated in transactions over a specific period. They are crucial for gauging user activity and network health. By monitoring changes in the number of active addresses, investors and analysts can infer the level of interest and involvement in Litecoin.
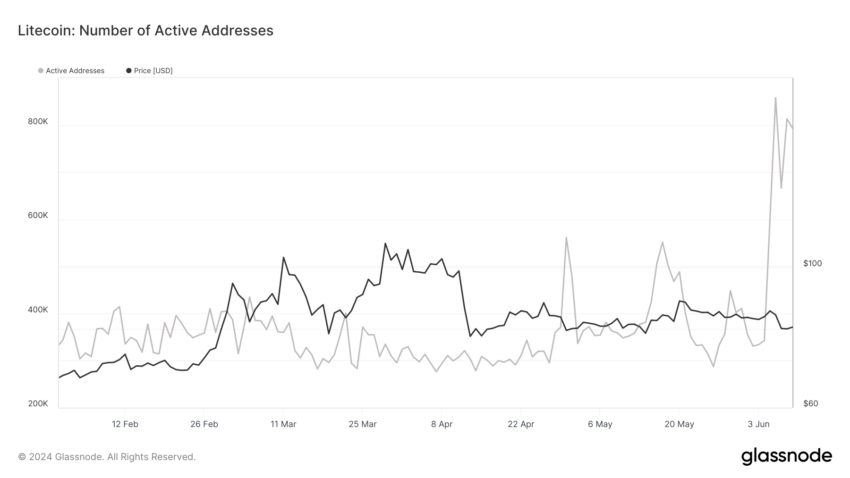
Recently, a remarkable increase in active addresses for Litecoin—from 340,000 to 860,000 in just the last week—points to a surge in user engagement.
This represents an influx of over 512,000 new active addresses engaging in Litecoin transactions, a significant figure that should not be overlooked.
Such an increase could drive the price of Litecoin to break through the daily Ichimoku Cloud. Potentially steering the price upward.
Strategic Recommendations
As Litecoin navigates turbulent waters, two main outcomes emerge. A decisive rise above the Ichimoku Cloud could end the current mid-term bearish trend and kickstart a bullish phase.
The bearish trend may continue if it fails to surpass the 100 and 200 EMAs on the 4-hour chart.
Read More: Litecoin (LTC) Price Prediction 2024/2025/2030
Additionally, Litecoin’s MVRV ratio is below 1. This indicates the market is undervalued and provides investors with a strategic entry point for a potential correction to fair value or higher.
This scenario, rich with technical indicators and on-chain data, demands a balanced strategy—seizing bullish opportunities while carefully managing risks.
Disclaimer
In line with the Trust Project guidelines, this price analysis article is for informational purposes only and should not be considered financial or investment advice. BeInCrypto is committed to accurate, unbiased reporting, but market conditions are subject to change without notice. Always conduct your own research and consult with a professional before making any financial decisions. Please note that our Terms and Conditions, Privacy Policy, and Disclaimers have been updated.
Source: https://beincrypto.com/litecoin-ltc-key-indicators-june-analysis/