Key takeaways
What triggered Litecoin’s sharp 22% price drop?
A broader market crash caused LTC to fall from $134.40 to $84.79 before partially recovering.
Are traders optimistic about a potential rebound?
Yes, increased long positions and $10.58 million in outflows suggest accumulation and hopes for recovery.
Amid the market crash, Litecoin [LTC] posted a 22% price dip, at press time, erasing all the gains it had made over the past two days.
Moreover, the hope of breaking out above the key resistance level of $143 also faded with the decline.
LTC price drops 22% amid market turmoil
At press time, LTC was trading around $98.90, reflecting a sharp 22% decline over the past 24 hours, according to CoinMarketCap.
The asset had previously shown strength near $134.40, but the broader market crash drove its price down to $84.79 before a partial recovery.
This steep drop, combined with a failed breakout above a key resistance level, has sparked heightened investor and trader activity. Trading volume surged by over 125%, reaching $3.95 billion.
On-chain metric signals potential reversal
Given the weak market sentiment, investors and traders seem to be seizing this dip as an opportunity, appearing to accumulate and bet strongly on long positions.
CoinGlass’s LTC Spot Inflow/Outflow metrics revealed that exchanges have recorded a significant $10.58 million worth of LTC outflows over the past 24 hours, as of writing, indicating potential accumulation.


Source: CoinGlass
Similarly, traders are following the same trend. The exchange liquidation map revealed that LTC’s major liquidation levels were at $97.7 on the lower side and $100.5 on the upper side.


Source: CoinGlass
At these levels, traders have built $2.02 million worth of long positions and $1.71 million worth of short positions.
This suggests a strong belief among traders in a potential upside, hoping the price will recover soon; however, the overall sentiment remains weak, making recovery challenging.
Litecoin price action and predictions
On the weekly chart, AMBCrypto’s technical analysis reveals that LTC has returned to a sideways parallel channel pattern, which it has been following since February 2022.


Source: TradingView
On the daily chart, LTC has closed below the key support level of $102.80, signaling the potential for further downside. If the price fails to reclaim the $105 level soon, analysts warn it could drop another 20%, possibly reaching $76 in the coming days.
At the time of writing, LTC’s Relative Strength Index (RSI) sat at 36, suggesting the asset is nearing oversold territory. However, the strong downward momentum may keep pressure on the price in the short term.
Despite this bearish outlook, one crypto expert has made a bold prediction. In a post on X, they shared a chart showing LTC nearing a breakout from a symmetrical triangle pattern on the weekly chart.
The post described LTC as “the sleeping giant” and projected a long-term target of $750.

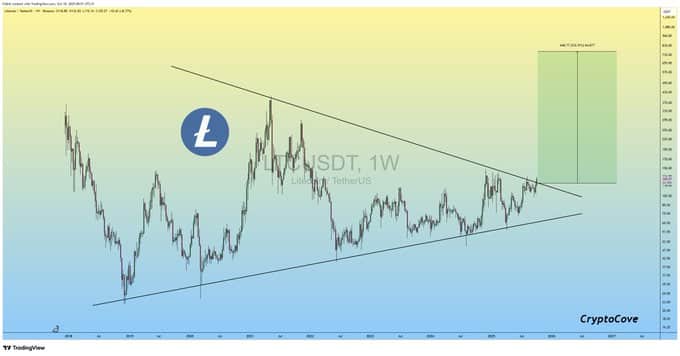
Source: X/CryptoFaibik
Source: https://ambcrypto.com/litecoin-down-22-could-this-crash-take-ltc-to-76/