- Cardano (ADA) strongly roots itself in the ninth spot by market cap.
- The daily trading volume of ADA surged by 138.39% to $1.06 billion.
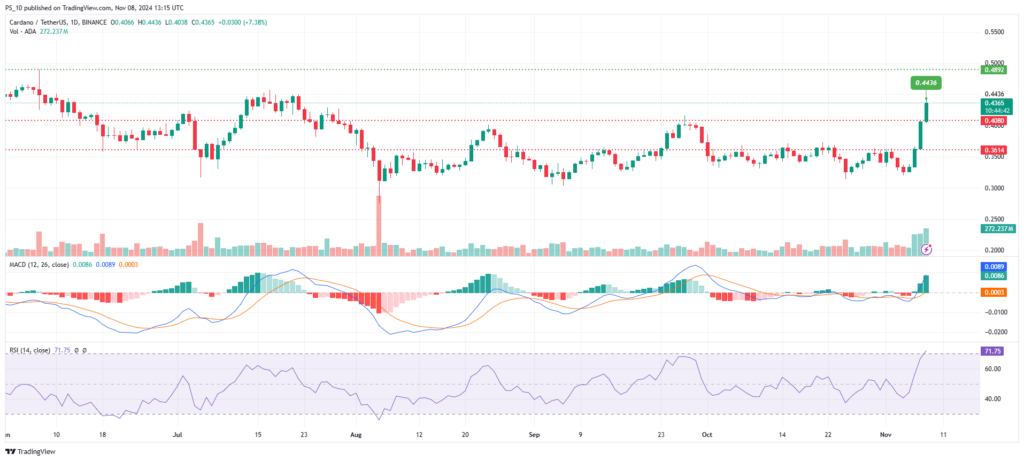
Bullish green hues overlay most charts in the crypto market as the pioneers near new peaks—Bitcoin (BTC) at its new ATH of $76.9K and Ethereum (ETH) approaching $3K. Among all altcoins, Cardano (ADA) recorded an optimistic 22.77% jump from $0.3613 to a 108-day high of $0.4436.
This price surge spurred Cardano bulls to drive the alt’s market capitalization to over $15.24 billion. Currently, ADA solidly claimed the ninth spot among the top 10 cryptocurrencies by market cap. According to crypto analytics platform Santiment, signs of a potential “retail FOMO” are emerging in the Cardano market.
🚀 Cardano has been one of the notable surprise altcoins taking flight during this crypto-wide pump. Now up over +25% in the past 3 days, we may be seeing some retail FOMO coming soon. This has been a long time coming for the patient ADA community. pic.twitter.com/Ph2ZFFKnIU
— Santiment (@santimentfeed) November 8, 2024
At the time of writing, ADA traded at $0.439 after experiencing a surge of 17.64% over the last 24 hours. Coinciding with this price rally, the daily trading volume soared 160.9% to $1.13 billion.
Cardano (ADA) Reflects Bullish Signs in Non-Price Aspects
The Cardano community’s enthusiasm had subdued and remained inactive for a long time. With the price rally, some bullish trends have started to appear, especially in non-price indicators of ADA.
Among the top 50 cryptocurrencies by market cap, Cardano recorded the highest bullish spike in daily active addresses. As per Santiment data, daily ADA addresses observed a 17% surge.
On the other hand, a surge of interest in Cardano on Google Searches was observed. Notably, the interest volume of the term ‘Cardano’ on the search engine jumped 400% over the week.


ADA is currently 85.98% away from its all-time high of $3.1, which was recorded on September 2, 2021. The mark is too distant, if then, to which higher mark is ADA headed in the potential bull market?
Is Cardano’s Trend Evolving?
The moving average convergence and divergence (MACD) indicator highlighted the emergence of an uptrend in the Cardano market. This is evident on the daily price chart, which shows the MACD line — the 12-day moving average (12MA) — crossing above the signal line — the 26-day moving average (26MA). In the current scenario, ADA is in an overbought condition as indicated by its relative strength index (RSI) at 71.88.


Upon powering up, the uptrend factors could push Cardano (ADA) to hit and test a high of $0.4892. A continued bullish trend could drive ADA to climb to $0.85, a level higher than the March high. Conversely, if the altcoin fails to hold above $0.4160, a downtrend could pull it down to key supports like $0.4080 and $0.3614.
Highlighted Crypto News Today
Can Ethereum (ETH) Break the $3K Threshold?
Source: https://thenewscrypto.com/is-this-really-the-resurgence-of-cardano-ada/