- Bitcoin’s Advanced NVT signaled a local bottom for the first time in 6 months
- BTC fell by 3.92% on the charts over the past week
Over the past month, Bitcoin [BTC] has struggled to maintain any upward momentum on the charts. In the last 30 days, BTC has traded sideways with high price fluctuations too. In fact, at the time of writing, the cryptocurrency was trading at $94,532 following a decline of almost 4% on the weekly charts.
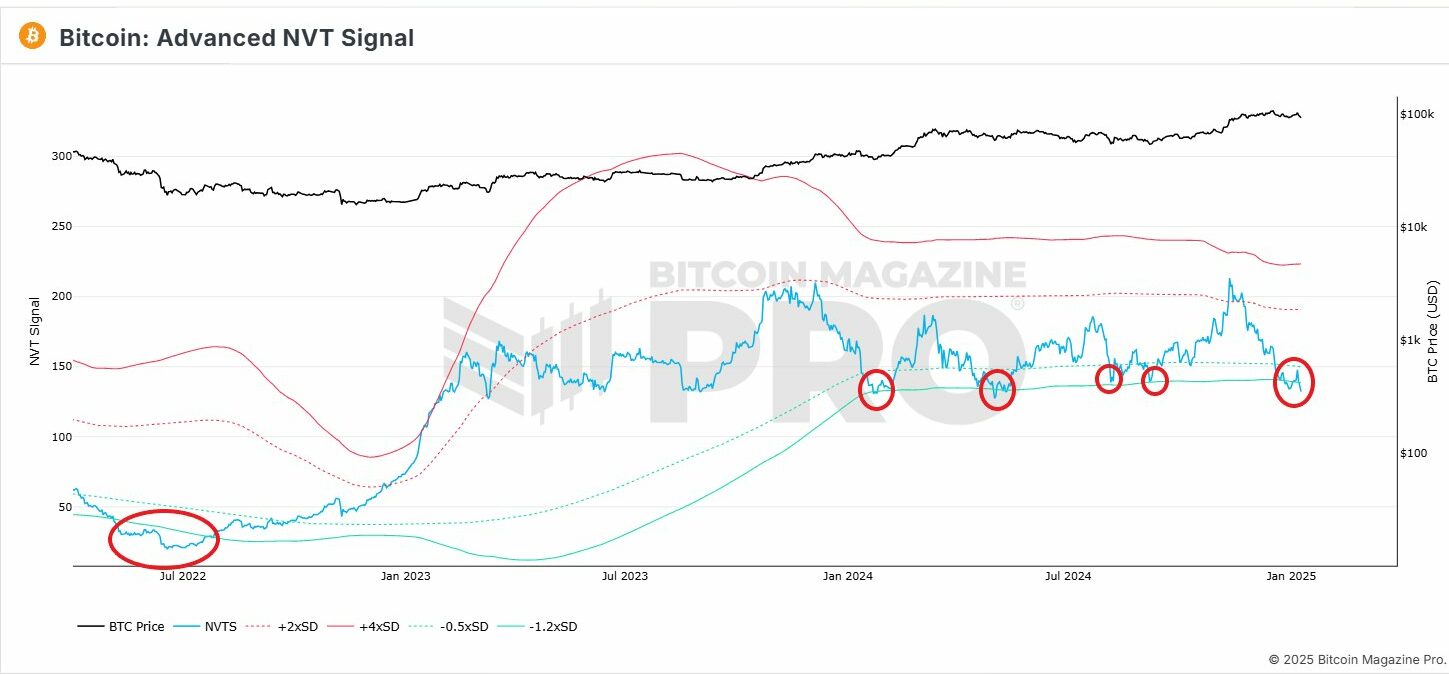
The prevailing market conditions have left analysts talking about Bitcoin’s price action and what might be next for the crypto. According to Cryptoquant’s Burak Kesmeci, for instance, a potential local bottom for BTC may be in now, with the analyst citing the Advanced NVT.
Is Bitcoin’s Advanced NVT indicating a local bottom?
In his analysis, Kesmeci posited that Bitcoin may have hit a local bottom. According to him, this assertion is based on the Advanced NVT alluding to the same for the first time in 6 months.


Source: X
Historically, when this signal emerges, Bitcoin records significant gains on the price charts. When an asset hits a local bottom, it’s usually an invitation for markets to engage in strong buying activity.
With higher buying pressure while sellers exit the market, prices start to recover. If this is indeed Bitcoin’s local bottom, it would mean that investors view the press time price as low and might soon start opening new positions.
Therefore, although Bitcoin has failed to continue with the speed observed in November, it’s early to take a call on the leading market trend. In fact, Kesmeci argued that there’s still room for growth since various on-chain data, especially the Advanced NVT, indicated so.
What does it mean for BTC’s price charts?
While the analysis provided above seemed to offer a promising outlook, it’s essential to determine what other market indicators suggested.
According to AMBCrypto’s analysis, although the Advanced NVT ratio may be signaling a potential reversal to the upside, other indicators told a different story. Simply put, they suggested BTC could drop even further, before reversing on the charts.
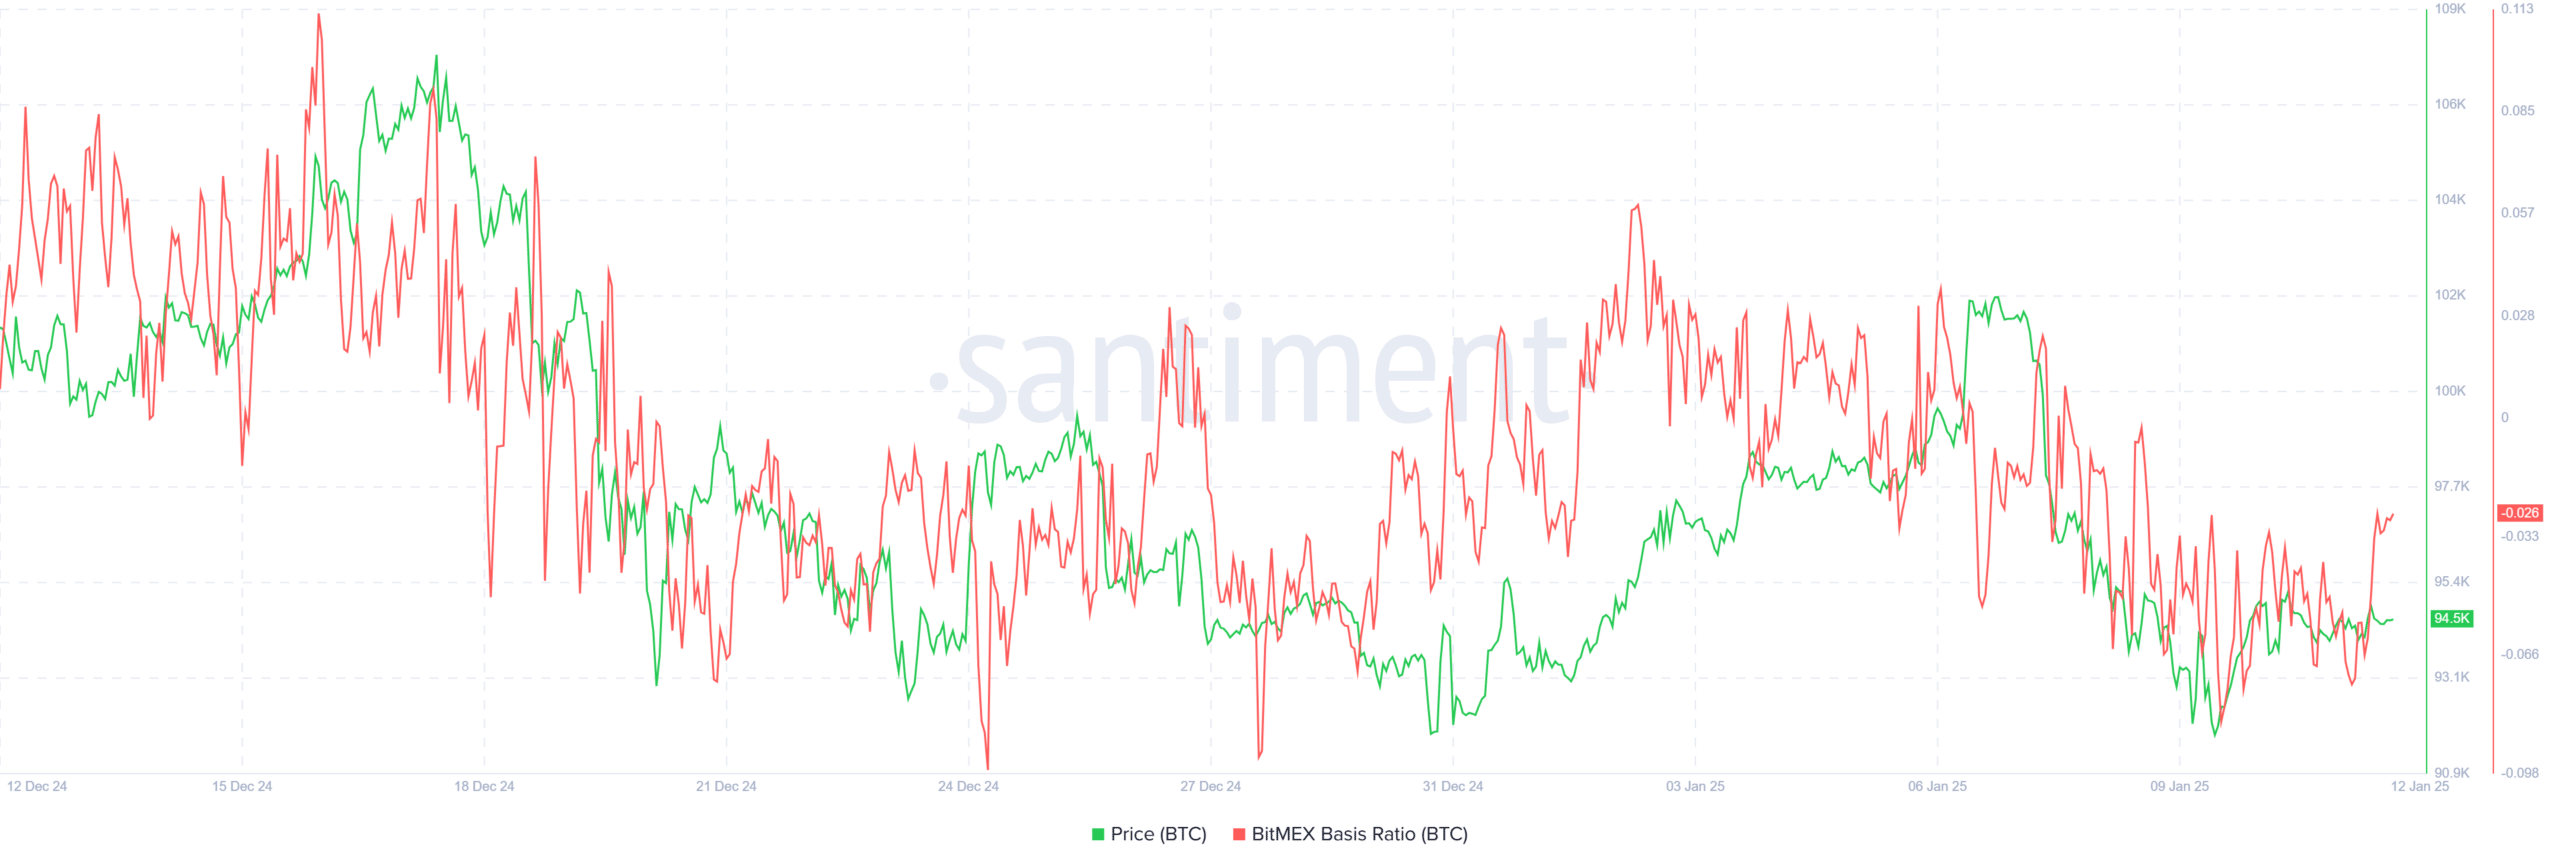
For starters, Bitcoin’s Bitmex basis ratio has remained negative over the past 4 days. When this turns negative, it indicates market backwardation where Futures prices trade below spot prices. Thus, investors are expecting the price to decline as the market is pricing in near-term bearish expectations.


Source: Santiment
This bearishness is even more prevalent among large holders. According to IntoTheBlock, Large Holders Netflow to Exchange Netflow Ratio spiked, rising from -0.33 to 0.01. When this turns positive, it implies that more large holders are transferring more BTC onto exchanges than withdrawing them.
This often precedes selling activity which may result in downward pressure on the asset’s price.


Source: IntoTheBlock
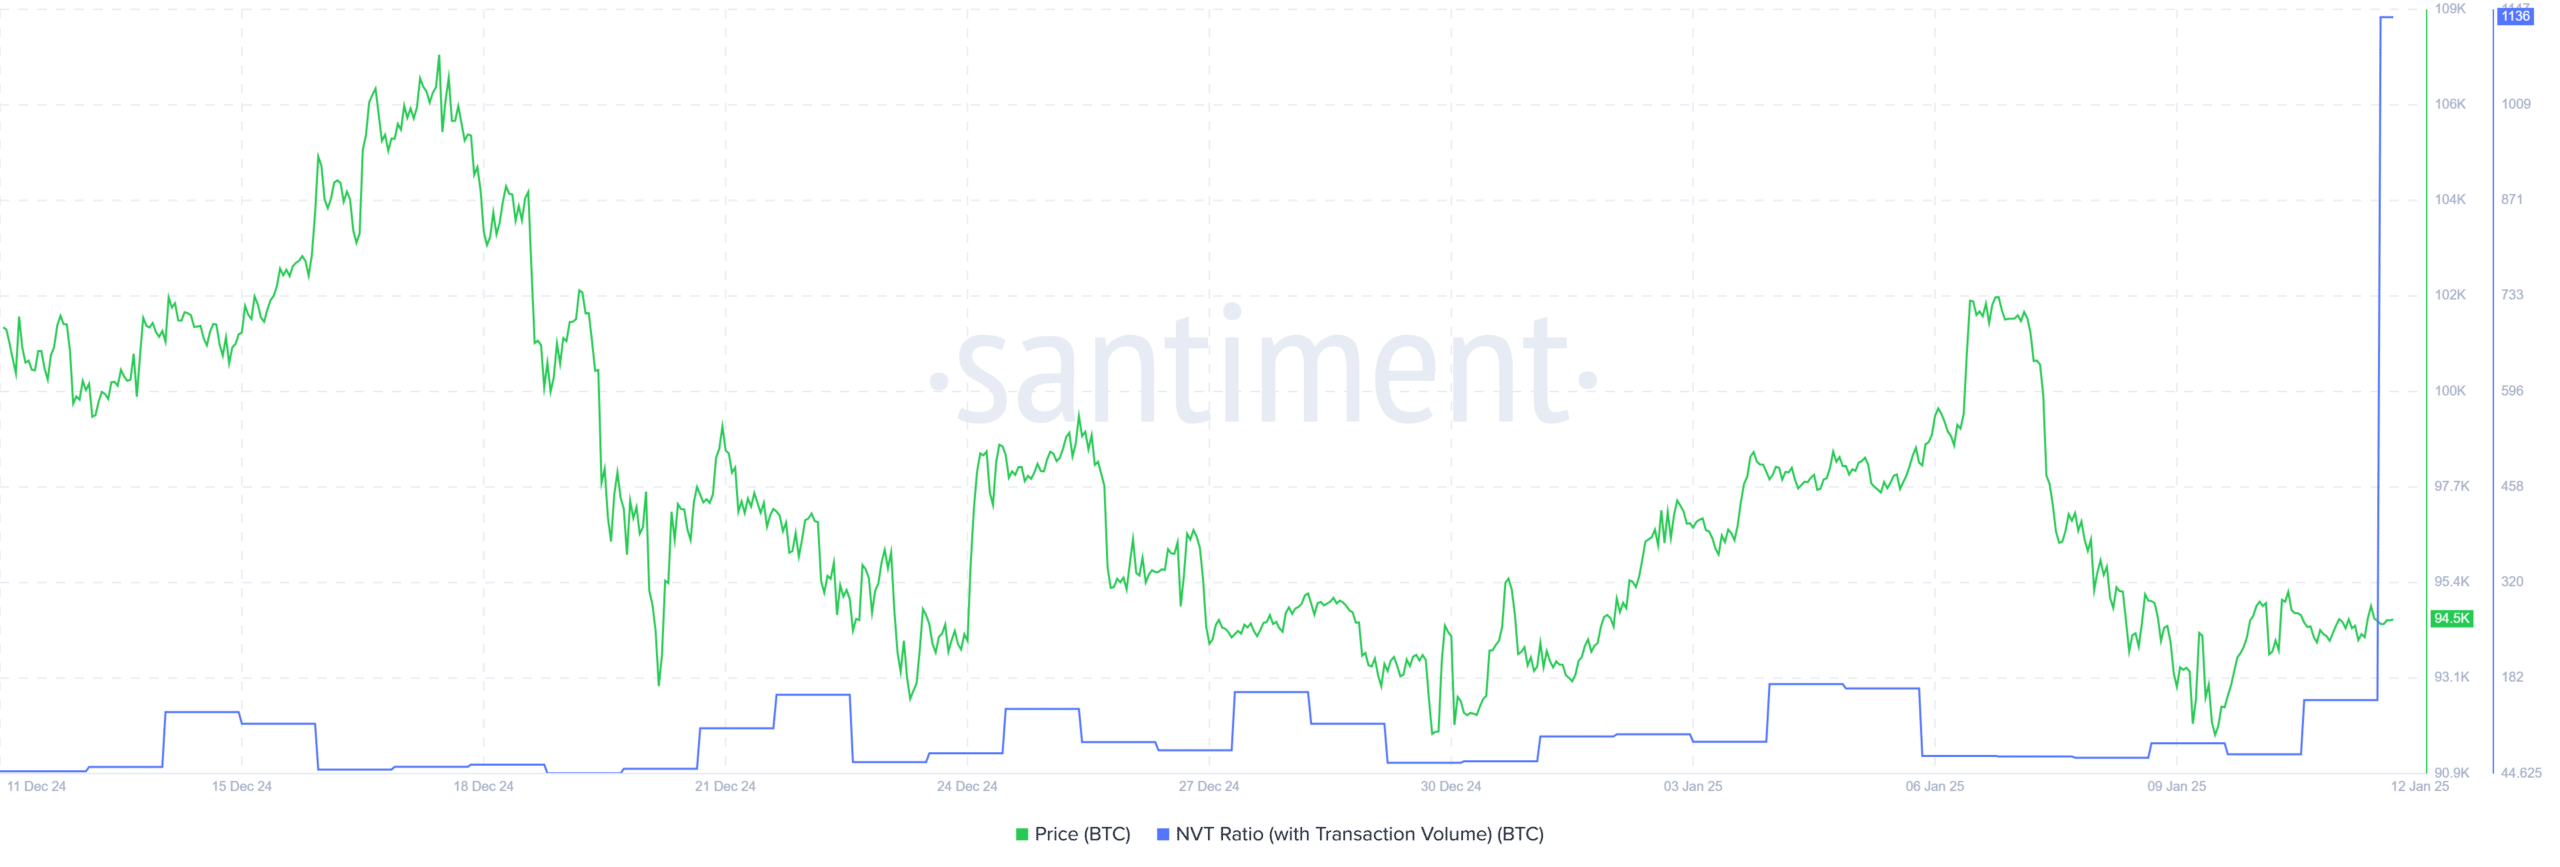
Finally, Bitcoin’s NVT ratio with transactions surged to extreme levels, hitting 1136.
This spike reflected reduced on-chain activity with low transaction volume, relative to BTC market value. This disconnect may cause overvaluation concerns and the price may retrace to meet the actual market demand.


Source: Santiment
Simply put, although the Advanced NVT may be signaling a local bottom, Bitcoin may still decline before attempting another uptrend.
Since market participants have been bearish lately, BTC may drop to $92480. However, if a local bottom is realized and a reversal to the upside occurs, BTC will reclaim $96,000 in the short term and then attempt $98,700.
Source: https://ambcrypto.com/bitcoin-is-a-local-bottom-in-this-metric-says-so-but/