- HYPE is currently trading within a descending channel, with the potential to fall further depending on how it reacts at its current level.
- Key indicators and Total Value Locked (TVL) remain bearish. However, the RSI is gradually hinting that sell pressure may be easing.
Hyperliquid [HYPE] ranks among the top losers in the market, dipping 16.57%, over the past 24 hours. This decline has reduced its monthly gains to 64.93%.
The token’s movement at its current price level will determine whether it stages a significant rally or faces further losses as market sentiment weakens.
Will HYPE yield positively from this pattern?
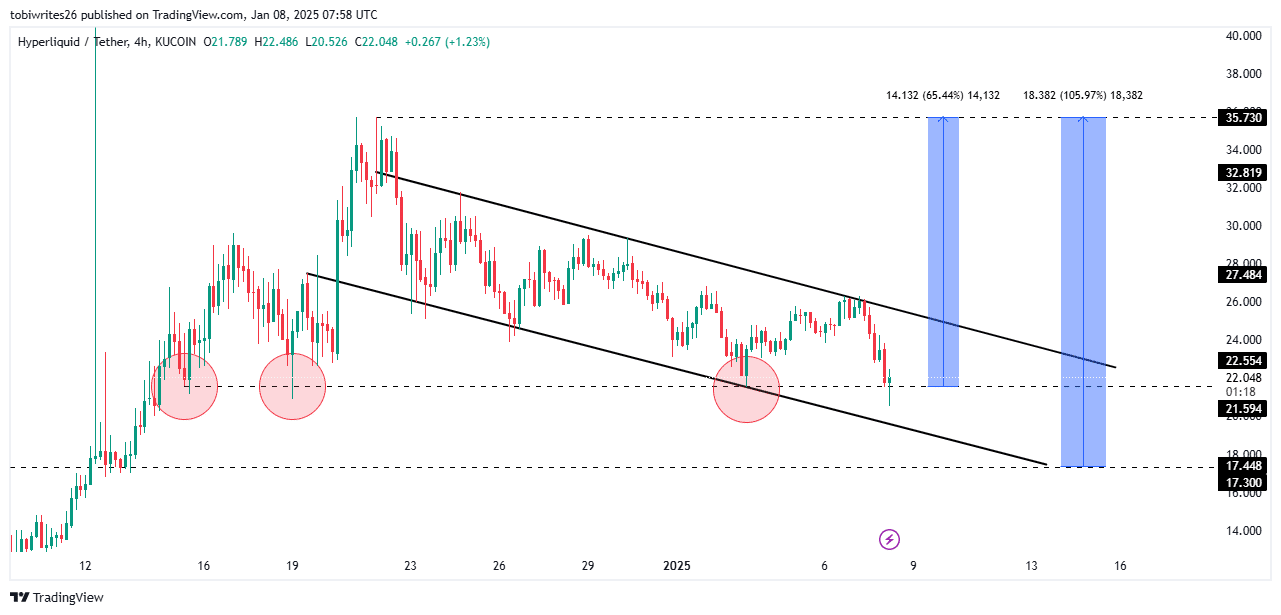
Technical analysis of HYPE’s 4-hour chart reveals that the asset is trading within a descending channel, characterized by lower highs and lower lows. Investors continue to accumulate in anticipation of an upward move.
A bullish breakout from this pattern occurs when the price breaches the upper resistance line of the channel, potentially reaching its peak of $35.7.
At the time of writing, HYPE is trading within a support zone at $21.59, which has previously acted as a bullish catalyst on three occasions. If this support provides the required momentum, HYPE could rebound and gain 65.44%, reaching the mentioned peak.


Source: TradingView
However, if the $21.59 support level is breached, HYPE could drop to the next support at $17.30. This level may act as a catalyst for a final push upward, potentially resulting in a 105.97% gain.
Mixed market signals
Currently, an analysis of technical indicators reveals mixed market sentiment, reflected in trader activity near the support level.
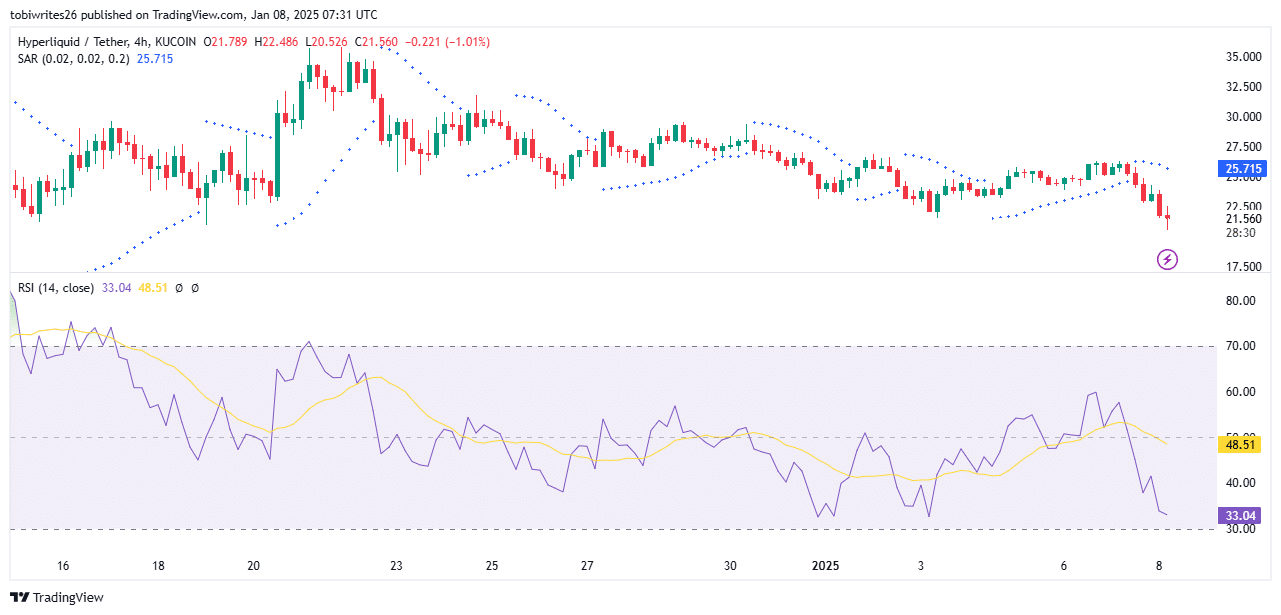
The Parabolic SAR (Stop and Reverse), which identifies trend directions and reversals through dots placed above or below price movements, currently shows dots above HYPE.
Dots above the price suggest a bearish market sentiment for HYPE, indicating that it could decline further from its current zone.


Source: TradingView
Meanwhile, the Relative Strength Index (RSI), another technical indicator, measures the speed and magnitude of price changes to identify overbought or oversold conditions.
At the time of writing, the RSI stood at 33.04, indicating increasing selling pressure as it approaches the oversold region. The RSI was heading toward the oversold region (below 30), suggesting that selling pressure may ease at that level.
If HYPE drops below the 30 mark, it could bounce back and begin a recovery. However, HYPE could reverse its trend from the current level without falling below 30.
Liquidity outflow hits HYPE
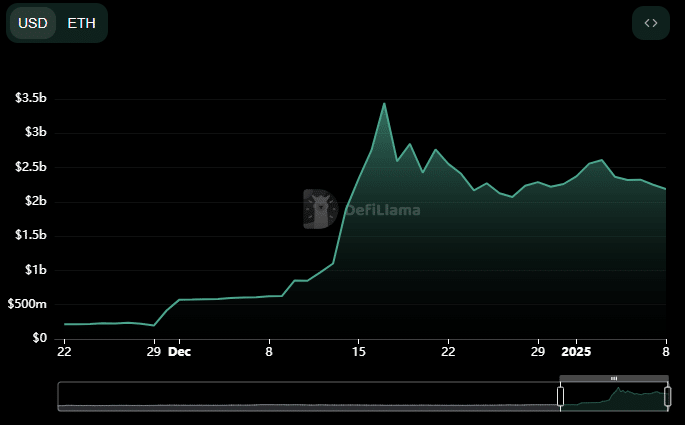
HYPE has experienced significant liquidity outflows, with its TVL dropping to $1.553 billion, a level last seen on December 14. This follows a peak of $2.244 billion on the 2nd of January.


Source: DeFiLlama
Read Hyperliquid’s [HYPE] Price Prediction 2025–2026
Liquidity outflows in TVL indicate declining interest, which often negatively impacts HYPE’s price and could lead to further declines.
If liquidity outflows persist, HYPE could continue to decline from its current level, potentially falling to even lower levels.
Source: https://ambcrypto.com/hyperliquid-hype-could-see-a-rebound-based-on-these-key-levels/