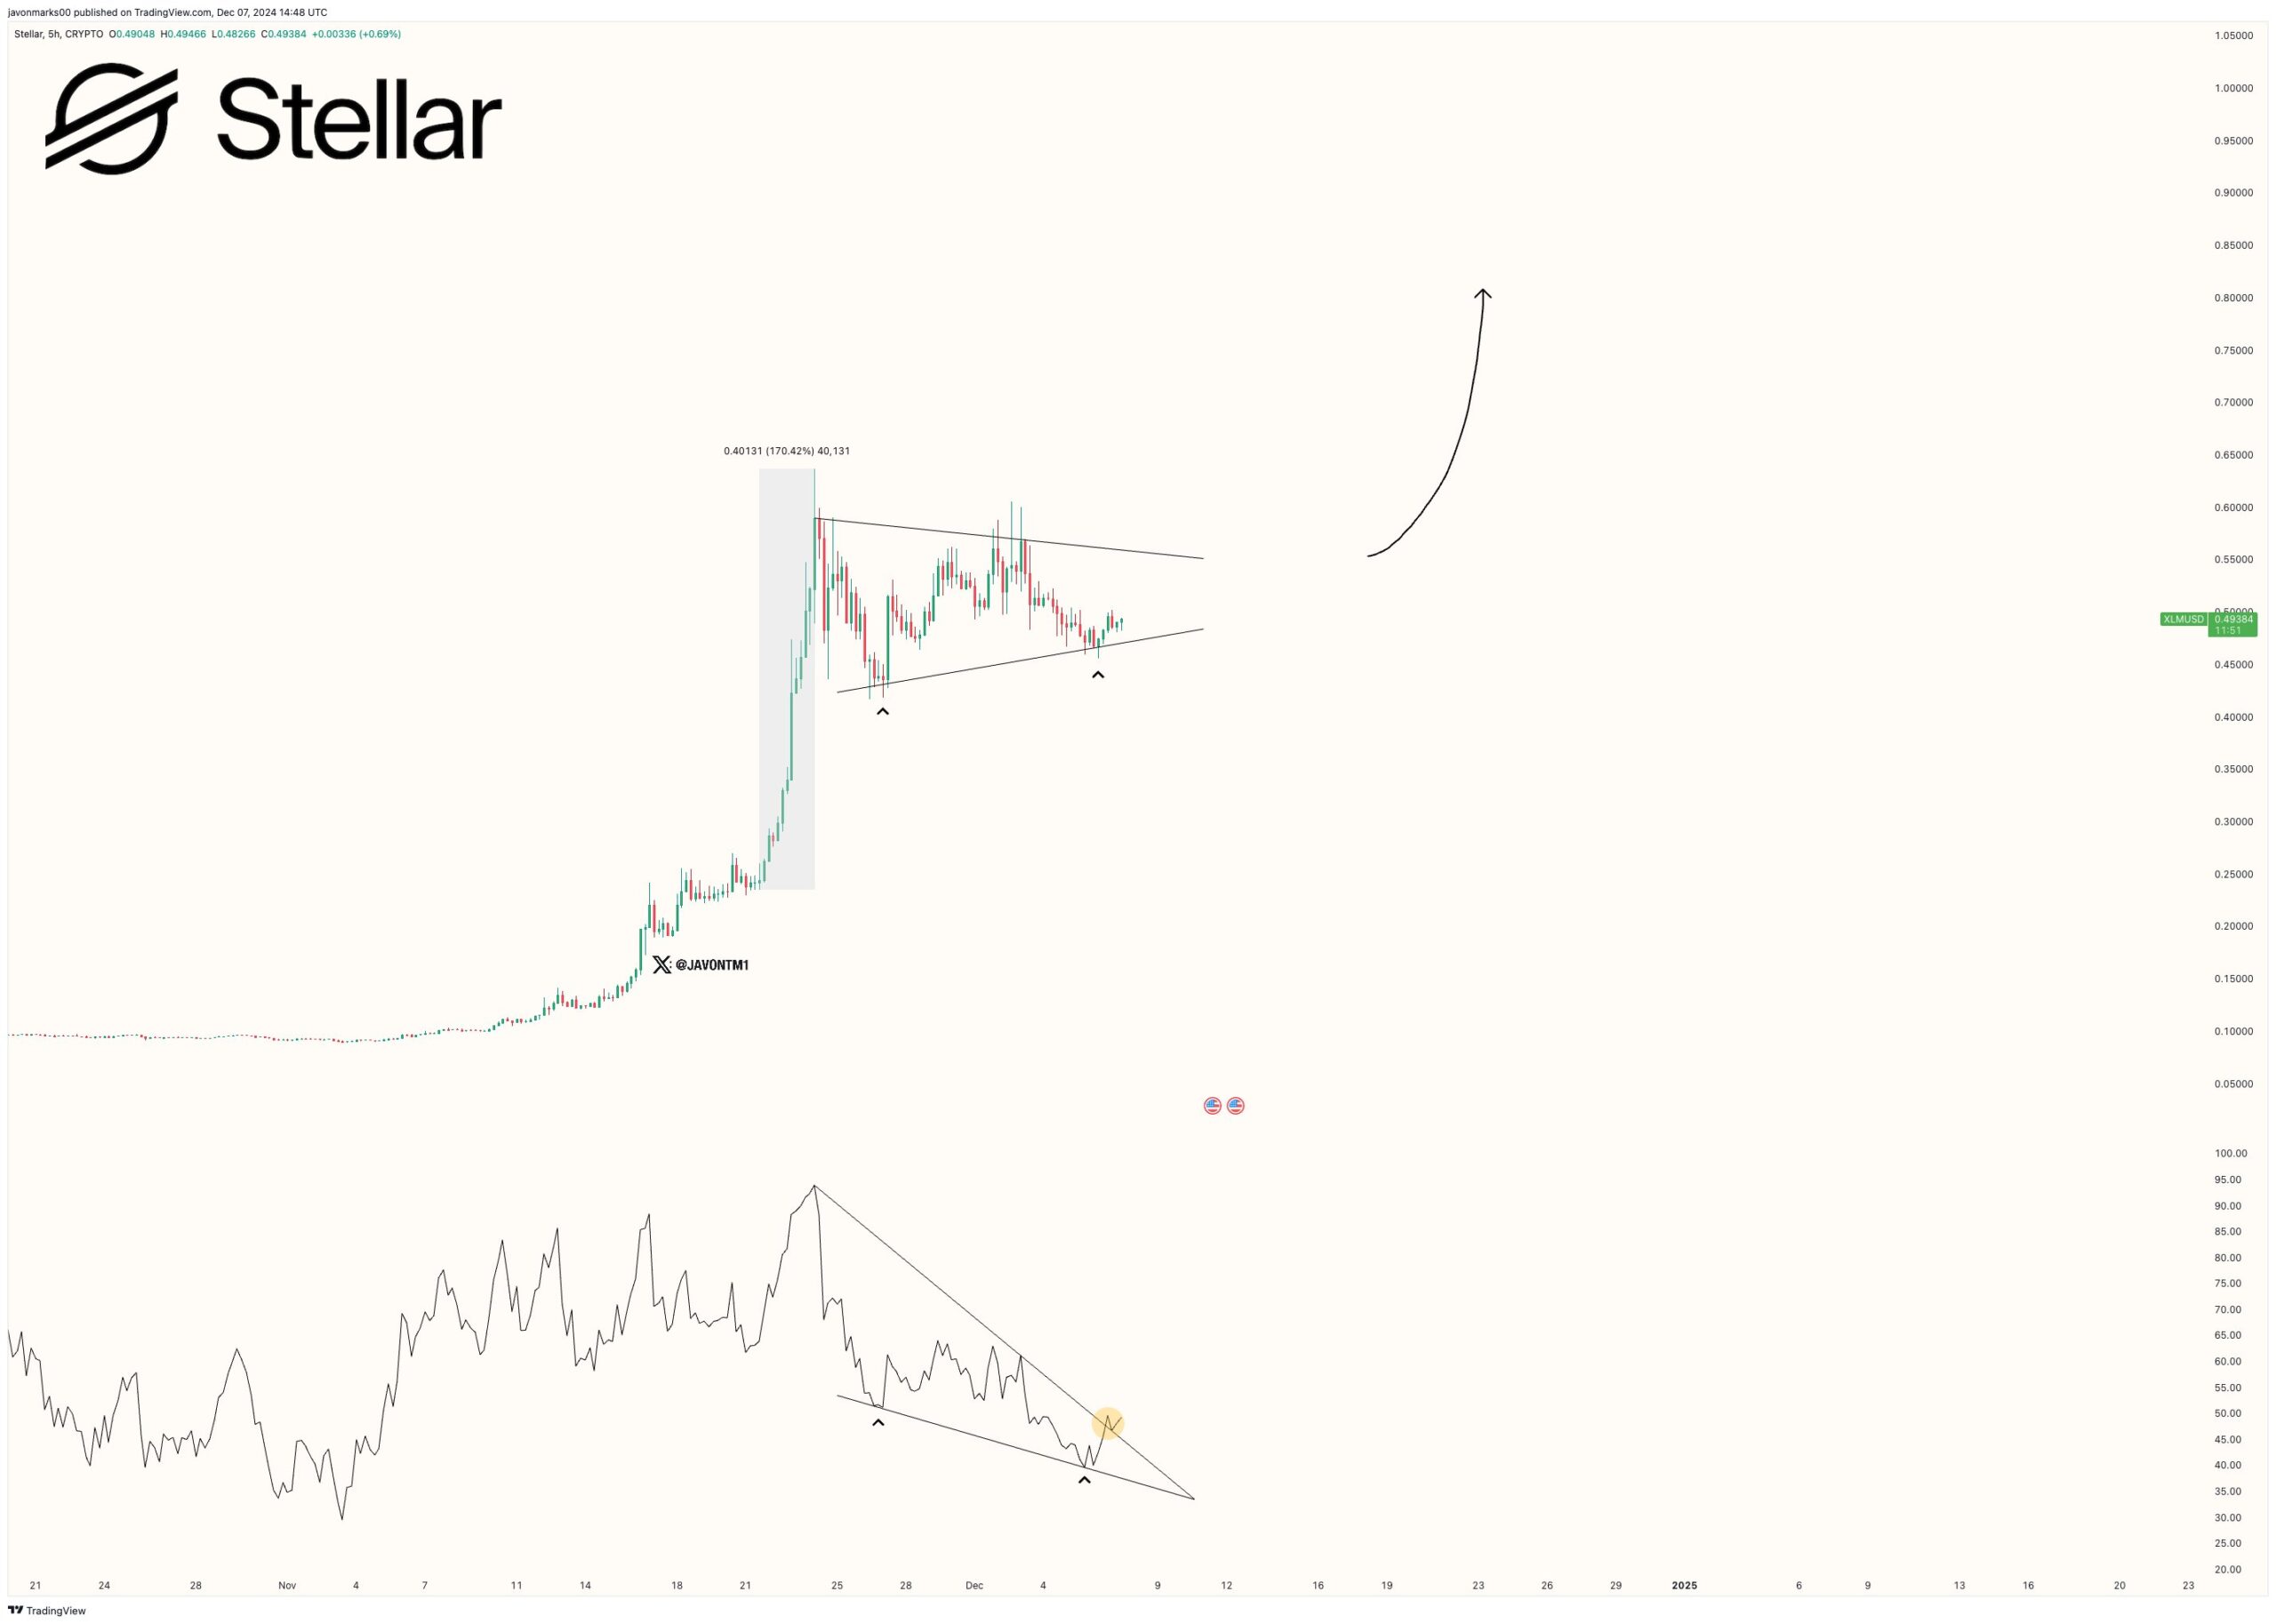
Stellar price has lost momentum this month, erasing some of the gains it made in November. The XLM coin trades at $0.4570, down by almost thirty percent from the year-to-date high. This retreat is likely because of the ongoing mean reversion, profit-taking, and the potential formation of a bullish pennant pattern.
3 Reasons Why The Stellar Price Has Suffered A Harsh Reversal
The XLM price has dropped by almost 30%, entering a local bear market this month. This decline is likely because of profit-taking among investors after it jumped to $0.6355 on November 24. At its highest level this year, the coin was up by 618% from its lowest point during the month. It is not uncommon for assets to waver or pull back after having a spectacular rally.
Stellar price is also likely falling because of mean reversion. In technical analysis, this is a situation where an asset moves back to its historic mean or average prices after rising or falling sharply. XLM price remains significantly higher than its 200-day, 100-day, and 50-day moving averages.
In line with this view, XLM price may be dropping because it has entered the markdown or distribution phase of the Wyckoff Method. According to Wyckoff, assets go through an accumulation, markup, distribution, and markdown phases.
One analyst believes that the ongoing Stellar crash is part of the formation of a bullish pennant pattern. In an X post, Javon Marks, a crypto analyst with almost 50,000 followers, said that the coin was in the process of forming the pennant.
He also noted that the Relative Strength Index (RSI) was forming a falling wedge pattern, which could lead to a strong bullish breakout. He expects that the Stellar Lumens price will rise to $0.9 this year, implying a 96% surge from the current level.
XLM Price Analysis: Is The Rally Over?
The daily chart shows that the Stellar Lumens price has retreated in the past few days. It has found some support at the 50-day Exponential Moving Average (EMA). Also, the retreat has coincided with the ongoing retreat of the Relative Strength Index (RSI), which has moved from the extremely overbought level at 94 to 57. The two lines of the MACD indicator have crossed each other and are pointing downward.
On the positive side, there are signs that the coin is forming a bullish pennant pattern as Javon suggests. This pattern is made up of a long vertical line, followed by a symmetrical triangle chart pattern, and is a popular sign of a continuation.
Therefore, if the pennant view is correct, Stellar price may bounce back in the next few days. If this happens, it may rise and retest the year-to-date high of $0.6360. A break above that level will point to more gains, possibly to $1.
On the flip side, a drop below the 50-day moving average at $0.4413 will invalidate the bullish view and point to a potential drop to the 50% retracement point at $0.3627.
Frequently Asked Questions (FAQs)
Stellar Lumens price is falling because of profit-taking after the recent rally, mean reversion, and possibly the formation of the bullish pennant pattern.
Yes, it is possible because the coin still has strong technicals and fundamentals. More upside will be confirmed if it moves above the year-to-date high of $0.6360.
The key XLM prices to watch will be the resistance point at $06360 and the support at $0.3627, the 50% retracement point.
Disclaimer: The presented content may include the personal opinion of the author and is subject to market condition. Do your market research before investing in cryptocurrencies. The author or the publication does not hold any responsibility for your personal financial loss.
Source: https://coingape.com/markets/heres-why-the-stellar-price-is-crashing-today/


✓ Share: