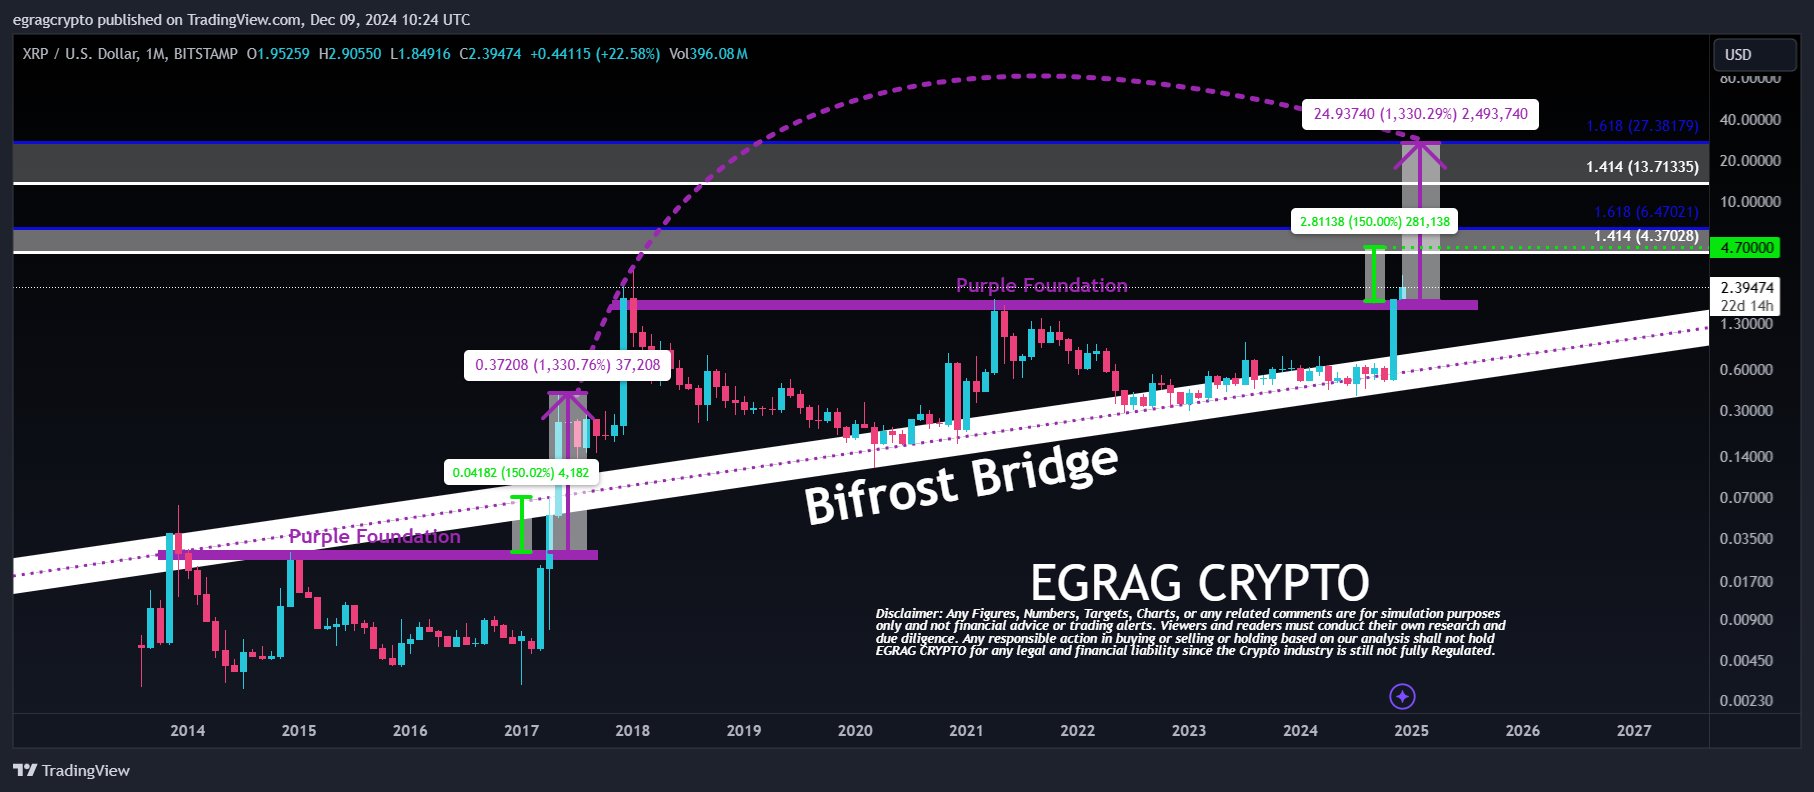
A prominent market analyst presents timelines for XRP to claim new heights, leveraging pointers from his “Bifrost Bridge” analysis.
The analysis comes on the back of XRP’s recent positive performance. The asset surged 283% in November, marking its best monthly performance in seven years. December is continuing this momentum, with XRP gaining an additional 26.4% just 12 days into the month.
Market analyst EGRAG has compared the ongoing rally with XRP’s trajectory in the 2017 cycle. He suggests that this current price behavior mirrors patterns observed before XRP achieved its all-time high (ATH) of $3.31 in January 2018.
Using his “Bifrost Bridge” analysis, EGRAG forecasts two potential price milestones for XRP: $6 and $27. Notably, he based these targets on Fibonacci retracement levels and historical price movements.
XRP Could Target $6 and $27
In his analysis, EGRAG highlighted XRP’s early 2017 market moves. For context, in March 2017, XRP rallied 150% from a critical support zone, which the analyst calls the “purple foundation.”
Interestingly, this initial rally set the stage for a more extraordinary 1,330% gain in May 2017. EGRAG projects that XRP’s ongoing uptrend could follow a similar trajectory. If the same percentage gains repeat, XRP may achieve new heights.
In the current December monthly candle, the analyst believes aims for the “gold region,” situated between $4.3 and $6.4. Data from the chart shows that these initial price targets align with Fibonacci retracement levels of 1.414 and 1.618.

Meanwhile, for the next monthly candle, January 2025, EGRAG sees a massive 1,330% rally that could push XRP into a second gold region. He expects this gold region to rest between the lofty prices of $13.7 and $27.3, aligning with another retracement zone.
EGRAG Dismisses Market Cap Skepticisms
Notably, previous skepticism about achieving such targets had emerged. They often center on the increased liquidity and larger market cap in today’s crypto markets. However, EGRAG addressed this by comparing the total market caps for 2017 and 2024 (TMC).
In May 2017, the crypto market cap stood at $60 billion. Today, it has ballooned to $3.7 trillion, marking a 6,000% increase or a 61x multiple. EGRAG suggests applying this same multiplier to XRP’s 2017 market cap of $15 billion. This would result in a hypothetical $900 billion XRP market cap.
Interestingly, to contextualize these figures, XRP would need to capture between 9% and 18% of the TMC, depending on whether it grows to $5 trillion or $10 trillion. Given XRP’s use cases in cross-border payments, such dominance in market share is considered feasible.
For context, Ripple CEO Brad Garlinghouse previously predicted that the TMC could rise to $5 trillion. Today, XRP trades for $2.48, boasting a market cap of $140 billion and 3.96% market dominance. If its dominance reclaimed the 2017 peak of 31%, this would translate to an XRP market cap of over $1 trillion.
DisClamier: This content is informational and should not be considered financial advice. The views expressed in this article may include the author’s personal opinions and do not reflect The Crypto Basic opinion. Readers are encouraged to do thorough research before making any investment decisions. The Crypto Basic is not responsible for any financial losses.
Source: https://thecryptobasic.com/2024/12/12/here-are-timelines-for-xrp-to-claim-6-and-27-as-per-bifrost-bridge-analysis/?utm_source=rss&utm_medium=rss&utm_campaign=here-are-timelines-for-xrp-to-claim-6-and-27-as-per-bifrost-bridge-analysis