- Berachain (BERA) is projected to trade between $5.36 and $11.33 in 2025, with further growth expected as the ecosystem expands.
- By 2030, BERA could reach a maximum of $50.60, driven by institutional adoption and increasing DeFi participation.
- Key support levels at $5.22 and resistance at $6.33 will determine short-term price action, while long-term growth depends on network utility and staking demand.
Berachain is a Layer 1 blockchain built for decentralized finance (DeFi) applications, using a unique Proof of Liquidity (PoL) consensus mechanism. This system allows users to stake tokens while providing liquidity, ensuring both network security and capital efficiency. Berachain integrates Ethereum Virtual Machine (EVM) compatibility, allowing developers to deploy smart contracts and build on its ecosystem with minimal adjustments.
The blockchain operates on a three-token model:
- BERA – The native gas token used for transactions, staking, and validator incentives.
- BGT – A governance and reward token, allowing holders to participate in network decisions.
- HONEY – A stablecoin designed for transactions and liquidity within Berachain’s ecosystem.
Berachain’s PoL system improves capital efficiency by allowing liquidity providers to stake without sacrificing asset utility. This creates a more sustainable DeFi ecosystem with high liquidity and reduced volatility.
Berachain (BERA) Price Prediction 2025-2030 Overview
| Year | Minimum Price (USD) | Average Price (USD) | Maximum Price (USD) |
| 2025 | $5.36 | $8.34 | $11.33 |
| 2026 | $10.50 | $18.26 | $25.00 |
| 2027 | $18.45 | $24.54 | $30.05 |
| 2028 | $20.00 | $26.75 | $32.56 |
| 2029 | $22.84 | $30.75 | $38.85 |
| 2030 | $25.45 | $37.85 | $50.60 |
What is Berachain (BERA)
Berachain is a next-generation blockchain designed to enhance decentralized finance (DeFi) by optimizing liquidity and security through its unique infrastructure. Unlike traditional blockchains, Berachain prioritizes capital efficiency, allowing users to earn staking rewards while maintaining access to liquidity. The network supports fast transactions, low fees, and seamless smart contract deployment, making it a preferred choice for DeFi applications.
Berachain tokenomics and key stats
- Market Capitalization: $620.4 million USD
- Fully Diluted Market Cap: $2.88 billion USD
- All-Time High (ATH) Price: $14.99 USD on February 6, 2025
- Circulating Supply: 107.48 million BERA
- Total Supply: 500 million BERA
- Volume-to-Market Cap Ratio: 0.88, indicating strong trading activity
- Market Performance: Experienced corrections after ATH due to market fluctuations
- Position in DeFi: Remains a key player in decentralized finance ecosystems
Bollinger Bands Analysis for Berachain (BERA)
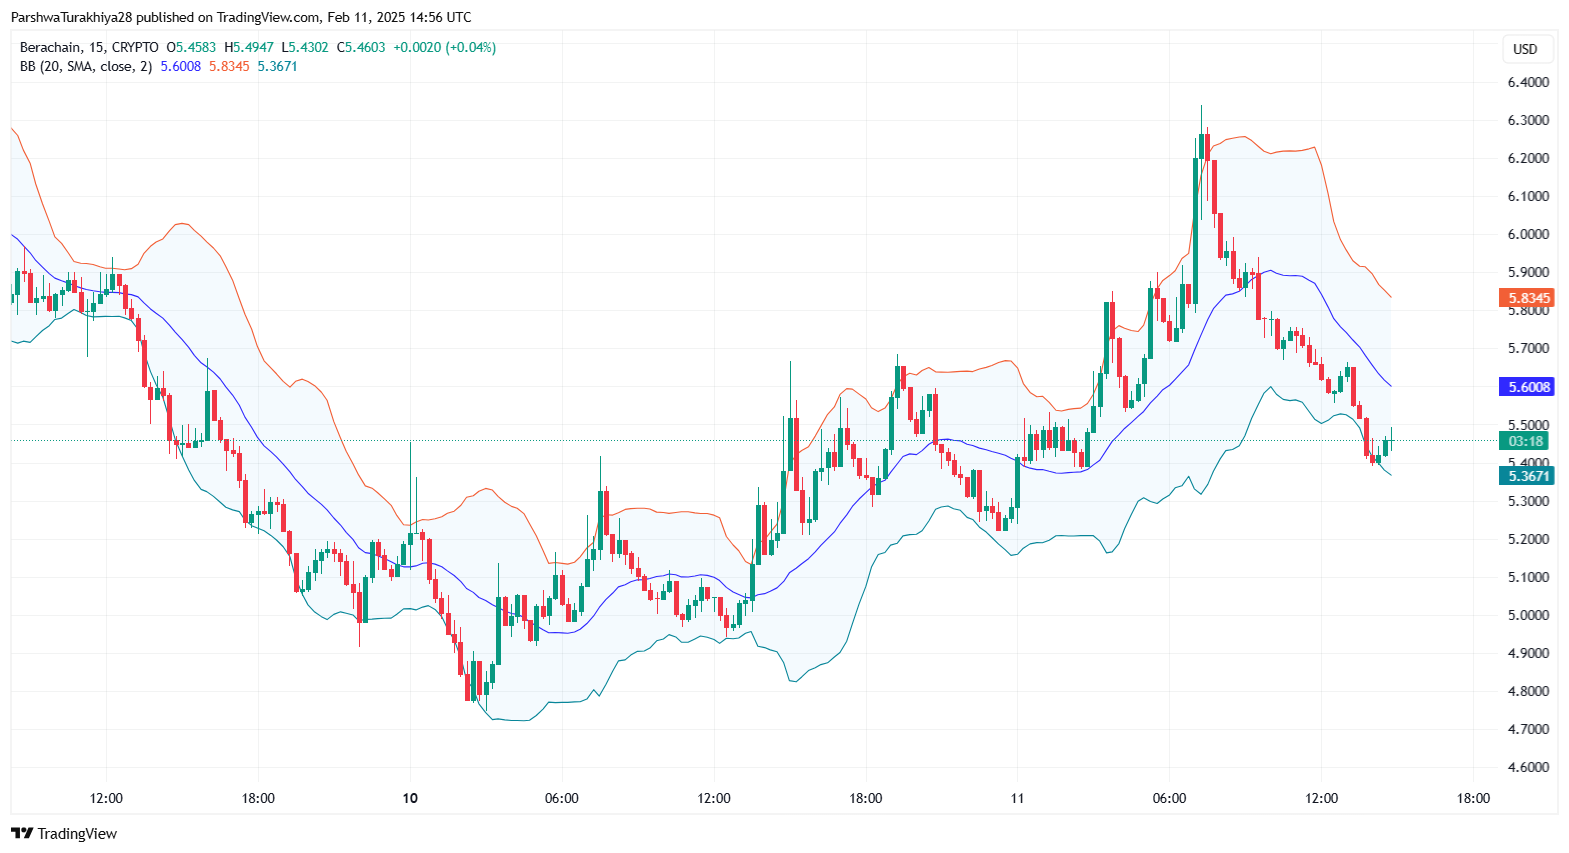

The Bollinger Bands indicator on the Berachain (BERA) chart shows increased volatility, with price action fluctuating between the upper and lower bands. The upper band is at $5.8665, the lower band at $5.3990, and the middle 20-day SMA at $5.6327. The price is currently near the lower band, indicating a possible oversold condition, which may lead to a short-term rebound if buying pressure increases.
A sustained move below the lower band could signal further downside momentum, while a reversal toward the middle band ($5.6327) would indicate a return to equilibrium. If BERA breaks above the upper band ($5.8665) with strong volume, it could confirm a bullish breakout, suggesting an upward trend continuation. However, if the price fails to reclaim the middle band, a retest of support levels around $5.39 may occur. Traders should watch for confirmation signals such as RSI trends and MACD crossovers to gauge the next price movement.
MACD Analysis for Berachain (BERA)
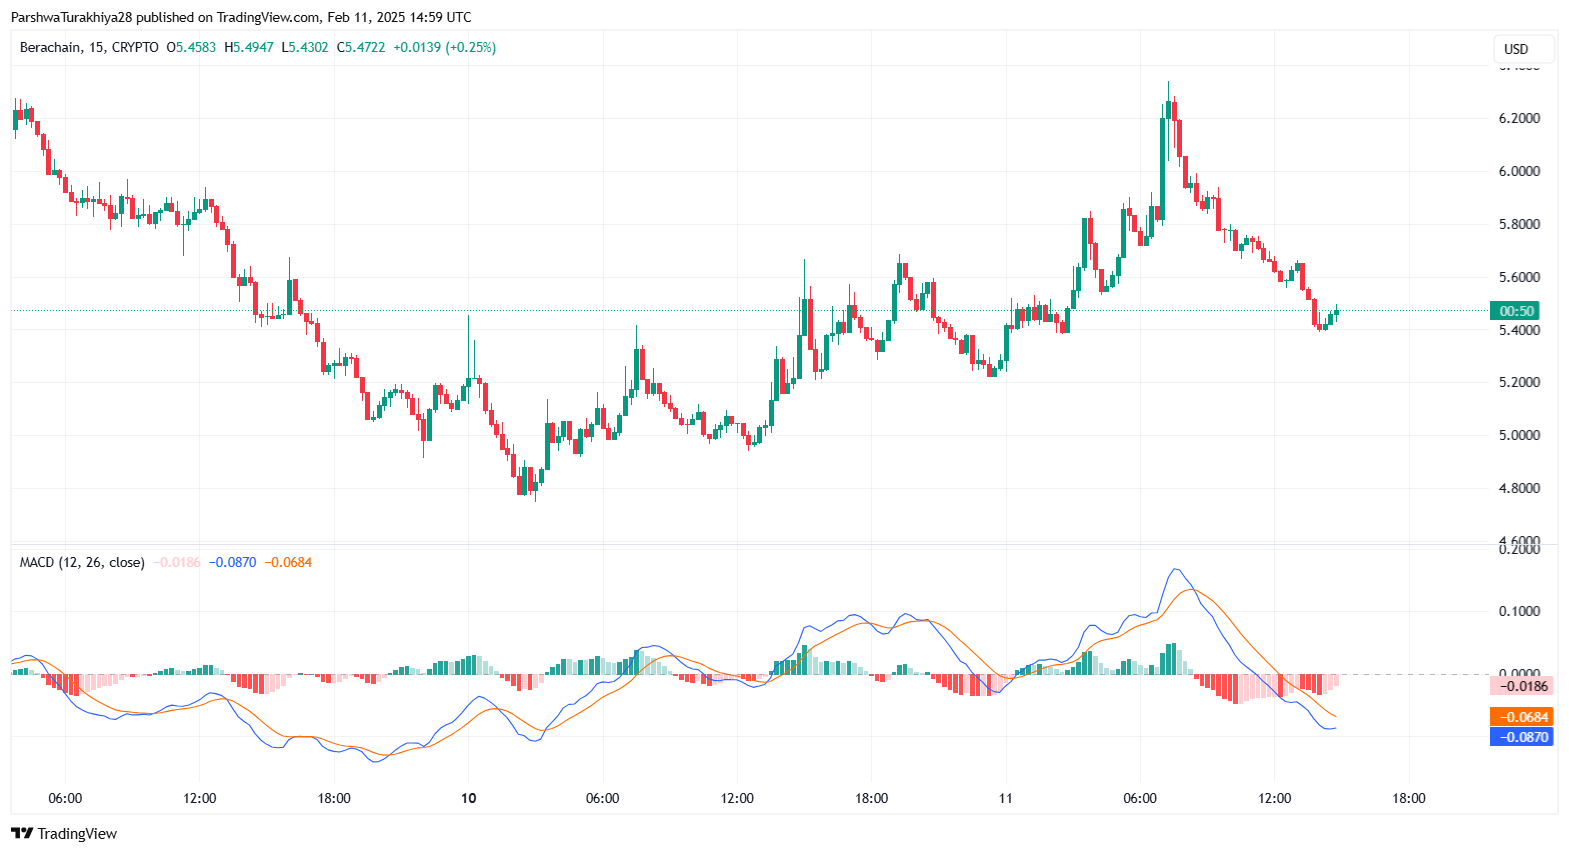
The MACD (Moving Average Convergence Divergence) indicator for Berachain (BERA) is currently showing a bearish crossover, with the MACD line (-0.0869) crossing below the signal line (-0.0684). This suggests that selling pressure is increasing, and a potential downtrend could continue unless there is a reversal. The histogram has turned red, indicating declining momentum, which further supports the possibility of short-term weakness.
However, if the MACD line starts to flatten or curl upwards, it could signal that selling pressure is weakening and a potential bullish reversal might occur. A strong recovery with increasing volume could push the MACD line back above the signal line, indicating renewed buying strength. Traders should watch for confirmation of support levels holding before considering long positions. If BERA continues to decline, support near $5.40 will be a crucial level to monitor for a potential bounce.
Relative Strength Index (RSI) Analysis for Berachain (BERA)
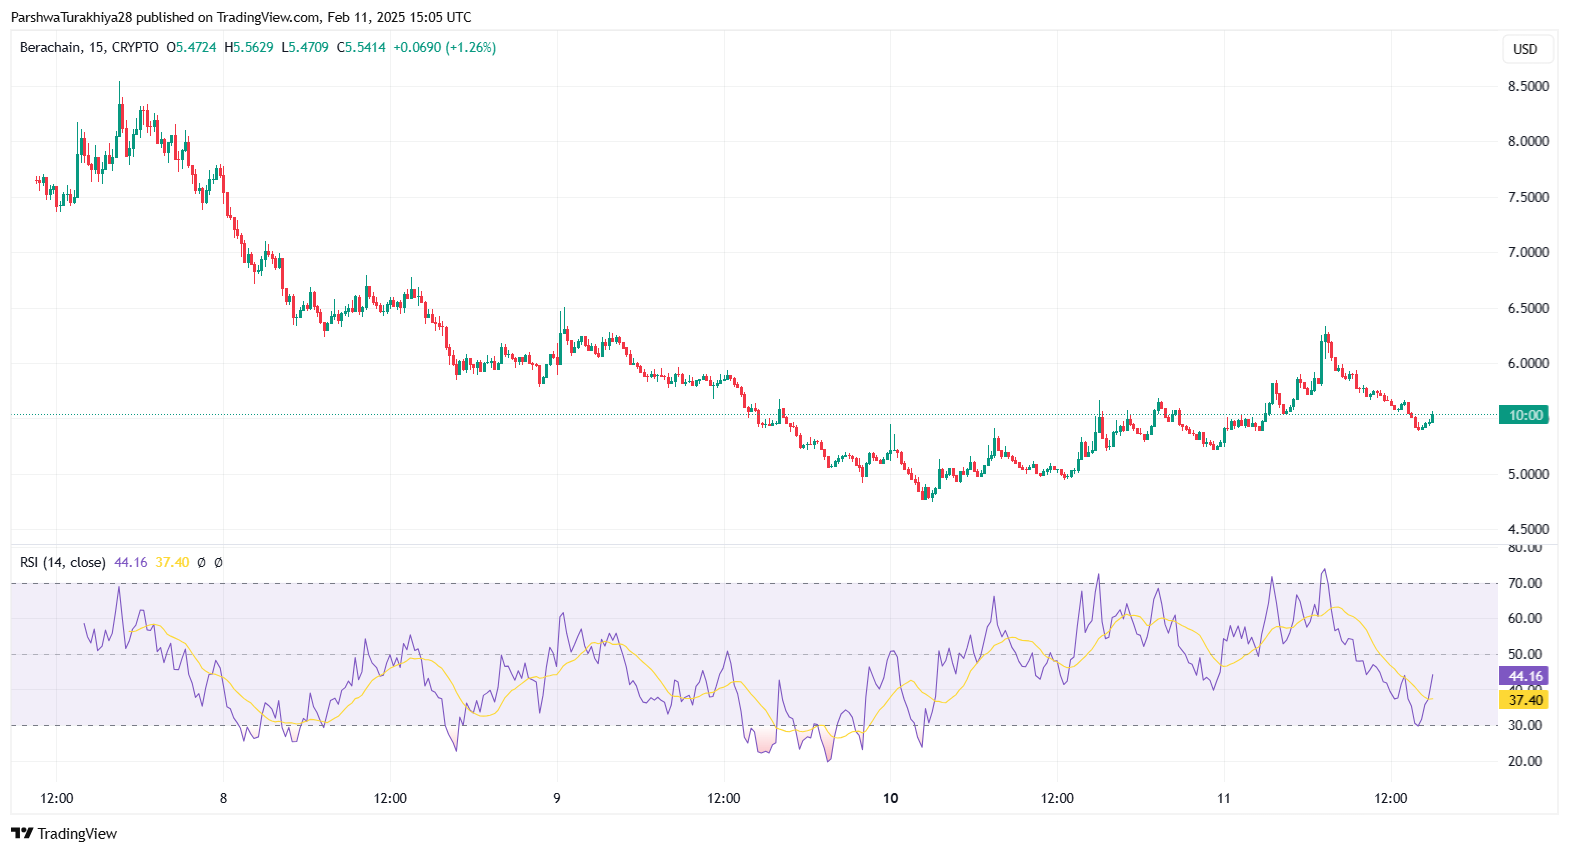
The Relative Strength Index (RSI) for Berachain (BERA) is currently at 43.00, indicating that the asset is in a neutral to slightly oversold zone. The RSI has recently rebounded from lower levels, suggesting that buyers are attempting to regain control after a period of selling pressure. However, since the RSI is still below the 50 mark, it signals that bearish sentiment is still dominant, and BERA may need further buying momentum to confirm a reversal.
If the RSI moves above 50, it could indicate increasing bullish strength, potentially pushing the price toward resistance levels. Conversely, if the RSI declines below 37, it may signal continued weakness, leading to a possible retest of lower support levels. Traders should monitor RSI along with price action to confirm trend direction, especially if it approaches the 70 level, which would indicate overbought conditions and potential for a pullback.
Support and resistance levels for Berachain (BERA)
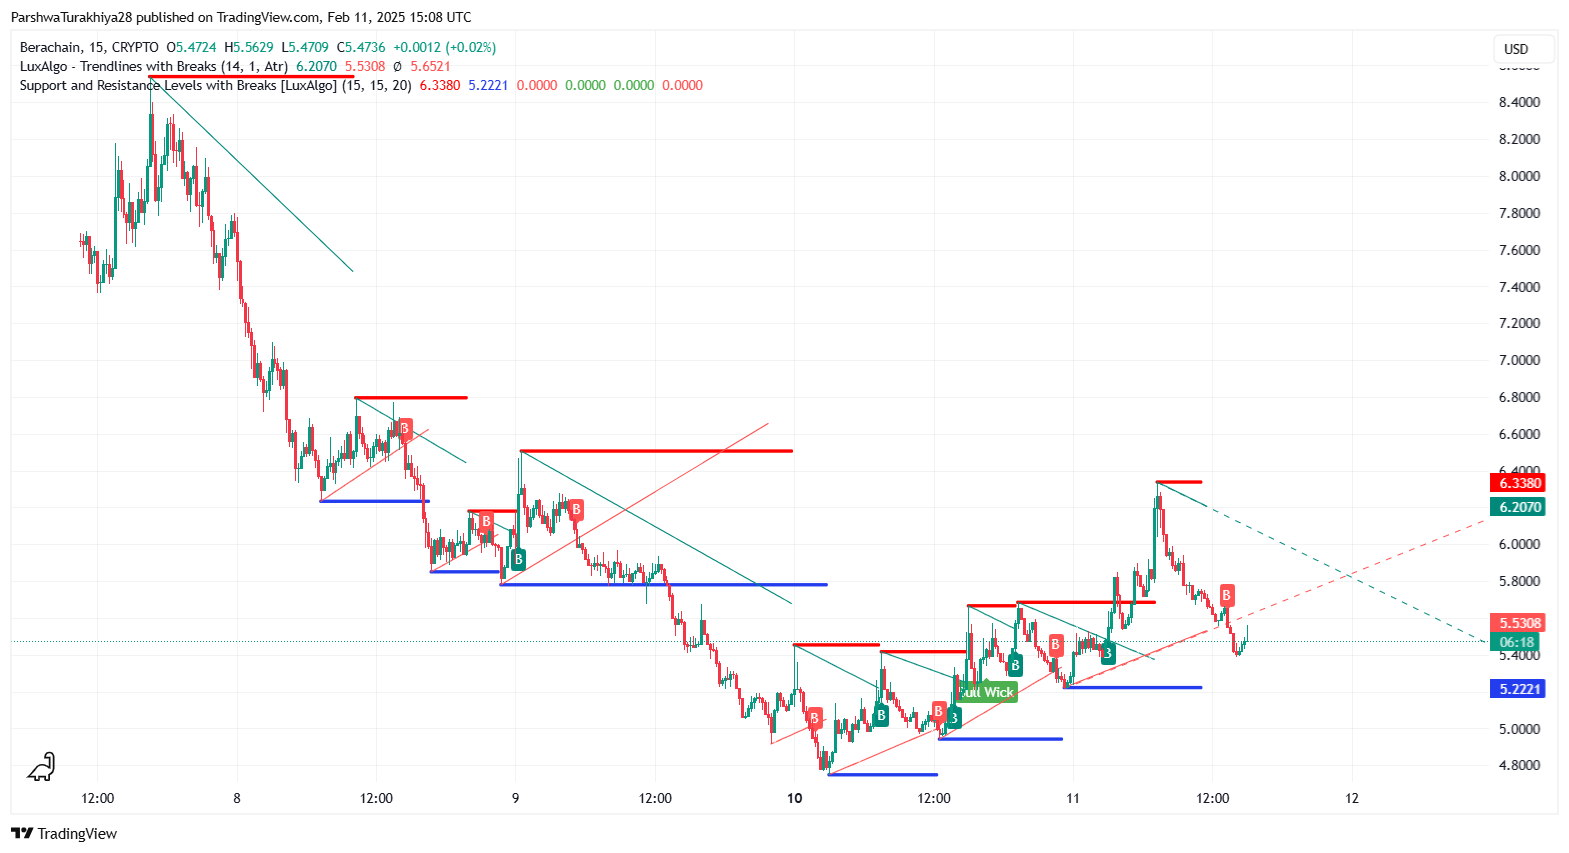
The support and resistance analysis for Berachain (BERA) highlights key price levels that could influence future movements. The immediate support level is at $5.2221, which has previously acted as a rebound zone. If the price sustains above this level, it could serve as a base for further upside movement. A breakdown below this level may push the price toward $5.00, where additional demand could emerge.
On the resistance side, the next key level is at $5.5308, which is acting as a short-term hurdle. If BERA breaks above this, it could rally toward the $6.2070 resistance level, where selling pressure may intensify. The major resistance is at $6.3380, which represents a historically strong rejection point. A successful breakout above this level would indicate strong bullish momentum and open doors for higher levels.
The current trendline structure suggests that BERA is attempting a recovery, forming a series of higher lows. However, failure to break above resistance could lead to a retest of support, confirming whether buyers can sustain the uptrend. Traders should watch for a breakout confirmation above $5.5308 for a bullish continuation or a rejection at resistance leading to consolidation.
Berachain (BERA) 2025 Price Prediction Analysis
Based on the projected price levels for 2025, BNX is expected to trade within a range of $0.1436 (minimum), $1.11 (average), and $1.28 (maximum). This forecast suggests a significant price appreciation from current levels, but with potential volatility along the way.
The minimum price of $0.1436 represents a scenario where BNX faces heavy resistance, possibly due to market corrections, regulatory challenges, or a bearish sentiment in the broader crypto market. If BNX retests this level, it could present a strong accumulation zone for long-term investors.
The average price of $1.11 suggests that BNX could maintain a steady upward trajectory throughout the year, supported by bullish technical indicators such as MACD bullish crossover, RSI strength, and recent breakout above key resistance levels. This aligns with the Bollinger Bands expansion, indicating increased volatility and potential price swings around this range.
The maximum price of $1.28 represents an optimistic scenario where BNX successfully breaks through resistance, particularly at $0.7773 and $1.00 as observed in our support and resistance analysis.
Berachain Price prediction for 2026
With a projected range of $10.50 to $25.00 and an average price of $18.26, BERA is expected to enter a higher valuation phase as its ecosystem matures. Growth in DeFi applications and higher staking participation could drive the price upward, provided market sentiment remains bullish.
Berachain Price prediction for 2027
BERA is forecasted to trade between $18.45 and $30.05, with an average price of $24.54. This period could mark an expansion phase where institutional interest and broader blockchain adoption push prices higher. Resistance near $30.05 will be key for further bullish momentum.
Berachain Price prediction for 2028
With a price range of $20.00 to $32.56 and an average of $26.75, BERA could continue its steady growth. By this time, the Berachain network may have developed stronger DeFi applications, improving its use cases and market positioning.
Berachain Price prediction for 2029
BERA could trade between $22.84 and $38.85, with an average price of $30.75. This stage may see heightened volatility, as macroeconomic factors influence the crypto market. If Berachain maintains strong ecosystem growth, higher valuations could be sustained.
Berachain Price prediction for 2030
The long-term outlook suggests a price range of $25.45 to $50.60, with an average price of $37.85. If Berachain becomes a leading player in the DeFi space, crossing the $50 mark could be possible. However, achieving this would require significant institutional adoption and continuous innovation within its ecosystem.
FAQs
In 2025, BERA is expected to trade between $5.36 and $11.33, with an average price of $8.34, assuming stable market conditions and ecosystem growth.
Key factors include ecosystem development, staking adoption, DeFi integration, market sentiment, regulatory updates, and overall crypto market trends.
The average price is determined by analyzing historical trends, expected market performance, and anticipated adoption of Berachain’s DeFi capabilities.
In 2025, key resistance levels include $5.5308, $6.2070, and $6.3380. A successful breakout above these could lead to a sustained bullish trend.
With a market cap of $620.4 million USD, BERA’s valuation reflects its current standing in the DeFi sector. Future price increases depend on liquidity inflows and adoption.
Indicators like Bollinger Bands show volatility levels, while RSI helps identify overbought or oversold conditions, guiding traders in timing entries and exits.
Achieving this level would require widespread adoption, institutional backing, a thriving DeFi ecosystem, and favorable global market conditions.
Yes, as with most cryptocurrencies, BERA’s price could see fluctuations based on external factors like market cycles, regulations, and investor sentiment.
Staking locks tokens, reducing supply while incentivizing long-term holding, which can drive price appreciation if demand remains strong.
While breaking past its ATH depends on bullish momentum and ecosystem growth, the long-term projections suggest BERA could significantly exceed this level in the next few years.
Disclaimer: The information presented in this article is for informational and educational purposes only. The article does not constitute financial advice or advice of any kind. Coin Edition is not responsible for any losses incurred as a result of the utilization of content, products, or services mentioned. Readers are advised to exercise caution before taking any action related to the company.
Source: https://coinedition.com/berachain-bera-price-prediction/