A market analyst believes XRP could target a range of $8 to $13 as multiple XRP pairs reverse from similar multi-year clusters.
XRP’s social mentions have spiked after Grayscale’s announcement of launching an XRP Trust. This trust marks an important milestone as the first of four steps toward introducing an XRP Exchange-Traded Fund (ETF).
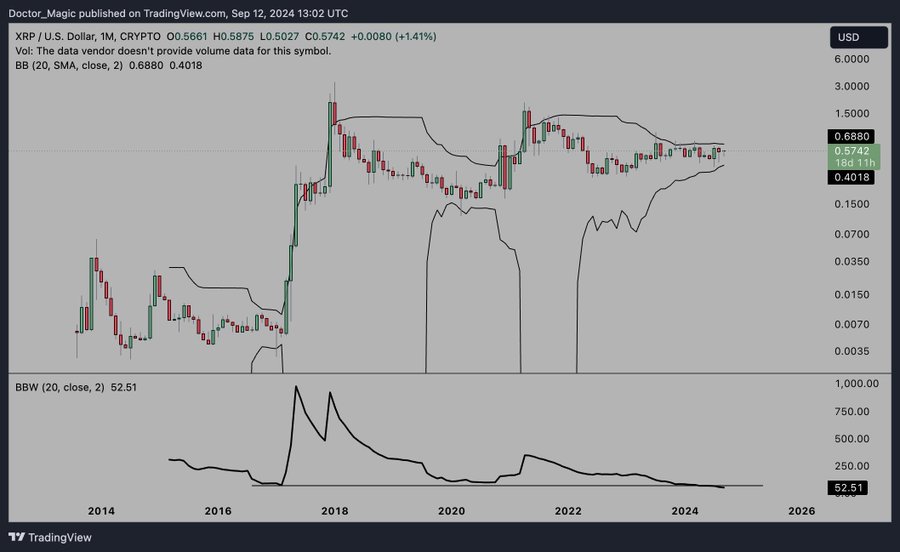
The launch has raised hopes that XRP could see a dramatic price movement in the coming months. Chiming in, Doctor Magic revealed that XRP’s volatility is at an all-time low, and a breakout could lead to an explosive upward move.
XRP Low Volatility and Potential Breakout
Notably, in an accompanying monthly chart, the Bollinger Bands (BB) indicator shows a volatility contraction that XRP has been experiencing for years. Specifically, the Bollinger Band Width (BBW) is at an extreme low, indicating a rare period of low volatility for XRP.

Such phases tend to be precursors to significant price action. Doctor Magic speculated that when the breakout occurs, XRP is likely to “send hard” as it exits a six-year consolidation pattern.
The launch of Grayscale’s XRP Trust could serve as a potential catalyst for this breakout. Investors now eye XRP with renewed optimism, speculating that institutional adoption via an ETF could be the key that unlocks XRP’s next leg up.
XRP Multiple Pair Clusters
Commenting on the BB analysis, an investor asked if $10 was possible for XRP. In response, Doctor Magic presented four important XRP trading pairs: XRP/BTC, XRP/NVDA, XRP/ETH, and XRP.D (XRP dominance).
The first chart, XRP/BTC, shows a multi-year decline. However, at the current levels, XRP has now found support, similar to the levels the market saw in the 2017 cycle.
Guys $8-13 is the 1.272 and the 1.414 Fibonacci extension targets . There is nothing lower to target after ATHs. Maybe you think I’m selling hopium , see the charts below , all $XRP pairs reversed from the same cluster that was created in 2017. #XRP #RIPPLE https://t.co/pg60h4QEY6 pic.twitter.com/JWUU3sEYKk
— Doctor Magic (@Doctor_Magic_) September 12, 2024
This observation is the same for the XRP/NVDA pair, which tracks XRP’s performance against Nvidia’s stock. Both charts suggest that XRP has bottomed out and is beginning to reverse from a significant historical support cluster.
Interestingly, the XRP/ETH chart also shows this reversal pattern. The pair highlights XRP strengthening against Ethereum, with a steady upward trajectory forming after hitting long-term support levels. Doctor Magic noted that all the charts display the same cluster reversal pattern.
XRP Dominance and Fib Extensions
The XRP.D chart measures XRP’s dominance in the overall cryptocurrency market. Over the past few years, XRP’s dominance has dwindled, but recently, the chart shows a subtle uptick. This rise in dominance suggests that XRP could begin to reclaim market share.
Using Fibonacci extension levels, Doctor Magic set ambitious price targets for XRP. In response to queries on whether $10 is possible, he suggested that XRP could reach between $8 and $13, pointing to the 1.272 and 1.414 Fibonacci extension levels.
Disclaimer: This content is informational and should not be considered financial advice. The views expressed in this article may include the author’s personal opinions and do not reflect The Crypto Basic’s opinion. Readers are encouraged to do thorough research before making any investment decisions. The Crypto Basic is not responsible for any financial losses.
Source: https://thecryptobasic.com/2024/09/13/expert-targets-8-to-13-on-fib-extensions-as-xrp-pairs-reversing-from-same-clusters/?utm_source=rss&utm_medium=rss&utm_campaign=expert-targets-8-to-13-on-fib-extensions-as-xrp-pairs-reversing-from-same-clusters