Dogwifhat Price Prediction examines the recent technical setup of the coin, which shows early signs of a potential bullish breakout after an extended consolidation phase.
Despite short-term hesitation across broader altcoin markets, the coin’s price action is testing a crucial descending trendline, drawing attention from traders anticipating a shift in momentum.
Analyst Notes Breakout Attempt as Price Climbs 12%
Crypto researcher Ruslan Khairullin highlighted a developing breakout pattern on the coin, noting that the token “looks ready to break out long.” The 4-hour coin chart displays a recent test of descending trendline resistance stemming from prior highs near $0.743, with current price action showing a breakout attempt above this line.

Source: X
At the time of analysis, the coin traded around $0.483 USDT, up 12.32% in the previous session. The chart shows recent consolidation between $0.422 and $0.499, followed by renewed upside movement backed by modest volume expansion — roughly 3.08 million tokens traded in 24 hours.
Khairullin emphasized that the token “moves with BTC, not against it,” suggesting that the coin’s directional bias will remain tied to Bitcoin’s broader momentum. The analyst cautioned traders to “keep those stops tight,” as a potential BTC correction could quickly invalidate the token’s breakout setup.
If the current breakout sustains above the trendline, market sentiment could shift bullishly, with short-term traders targeting continuation toward higher resistance levels. Still, confirmation through price follow-through and stronger volume remains essential to rule out a false breakout scenario.
Market Data: Trades Lower at $0.47 as Market Consolidates
According to BraveNewCoin, Dogwifhat is currently priced at $0.47, marking a 3.47% decline over the last 24 hours. The token holds a market capitalization of approximately $469.51 million, supported by a daily trading volume of $135.04 million. With an available supply of 998.9 million coins, the asset ranks 179th among global cryptocurrencies.
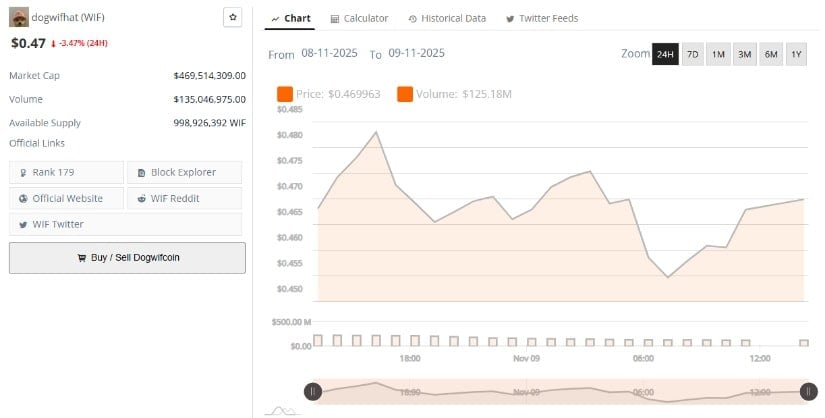
Source: BraveNewCoin
The market’s pullback from earlier highs underscores the near-term uncertainty that continues to dominate lower-cap meme and community tokens. Despite recent upside moves, trading activity remains range-bound, reflecting cautious participation and limited momentum beyond short-term speculative bursts.
Technical Indicators: Neutral Momentum Persists as Bollinger Bands Tighten
A review of TradingView data shows WIF/USDT trading near $0.47, fluctuating just below the Bollinger Band basis line at $0.50. The Bollinger Bands have tightened notably compared to previous months, signaling reduced volatility and the emergence of a consolidation phase.

Source: TradingView
For bullish momentum to strengthen, the coin would need to close consistently above the mid-band and sustain movement toward the upper band near $0.59. Rejection in this zone, however, may pressure price action back toward the lower band around $0.40, which remains key structural support.
Volume and momentum indicators highlight lingering caution among traders. The Chaikin Money Flow (CMF) currently prints at -0.02, reflecting weak capital inflows and neutral-to-bearish accumulation patterns. This aligns with the moderate volume levels seen across exchanges, suggesting that participants are waiting for clearer confirmation before committing to larger directional positions.