- DOGE’s price chart on the 1-hour timeframe revealed a symmetrical triangle, consolidating between $0.236 and $0.224 before breaking downward.
- DOGE’s volatility data, tracked in the 4-hour chart, showed a declining trend over the past 24 hours.
Dogecoin [DOGE] recently displayed significant price movement, breaking out of a symmetrical triangle pattern.
Dogecoin’s price analysis on the 1-hour timeframe revealed a symmetrical triangle, consolidating between $0.236 and $0.224 before breaking downward.

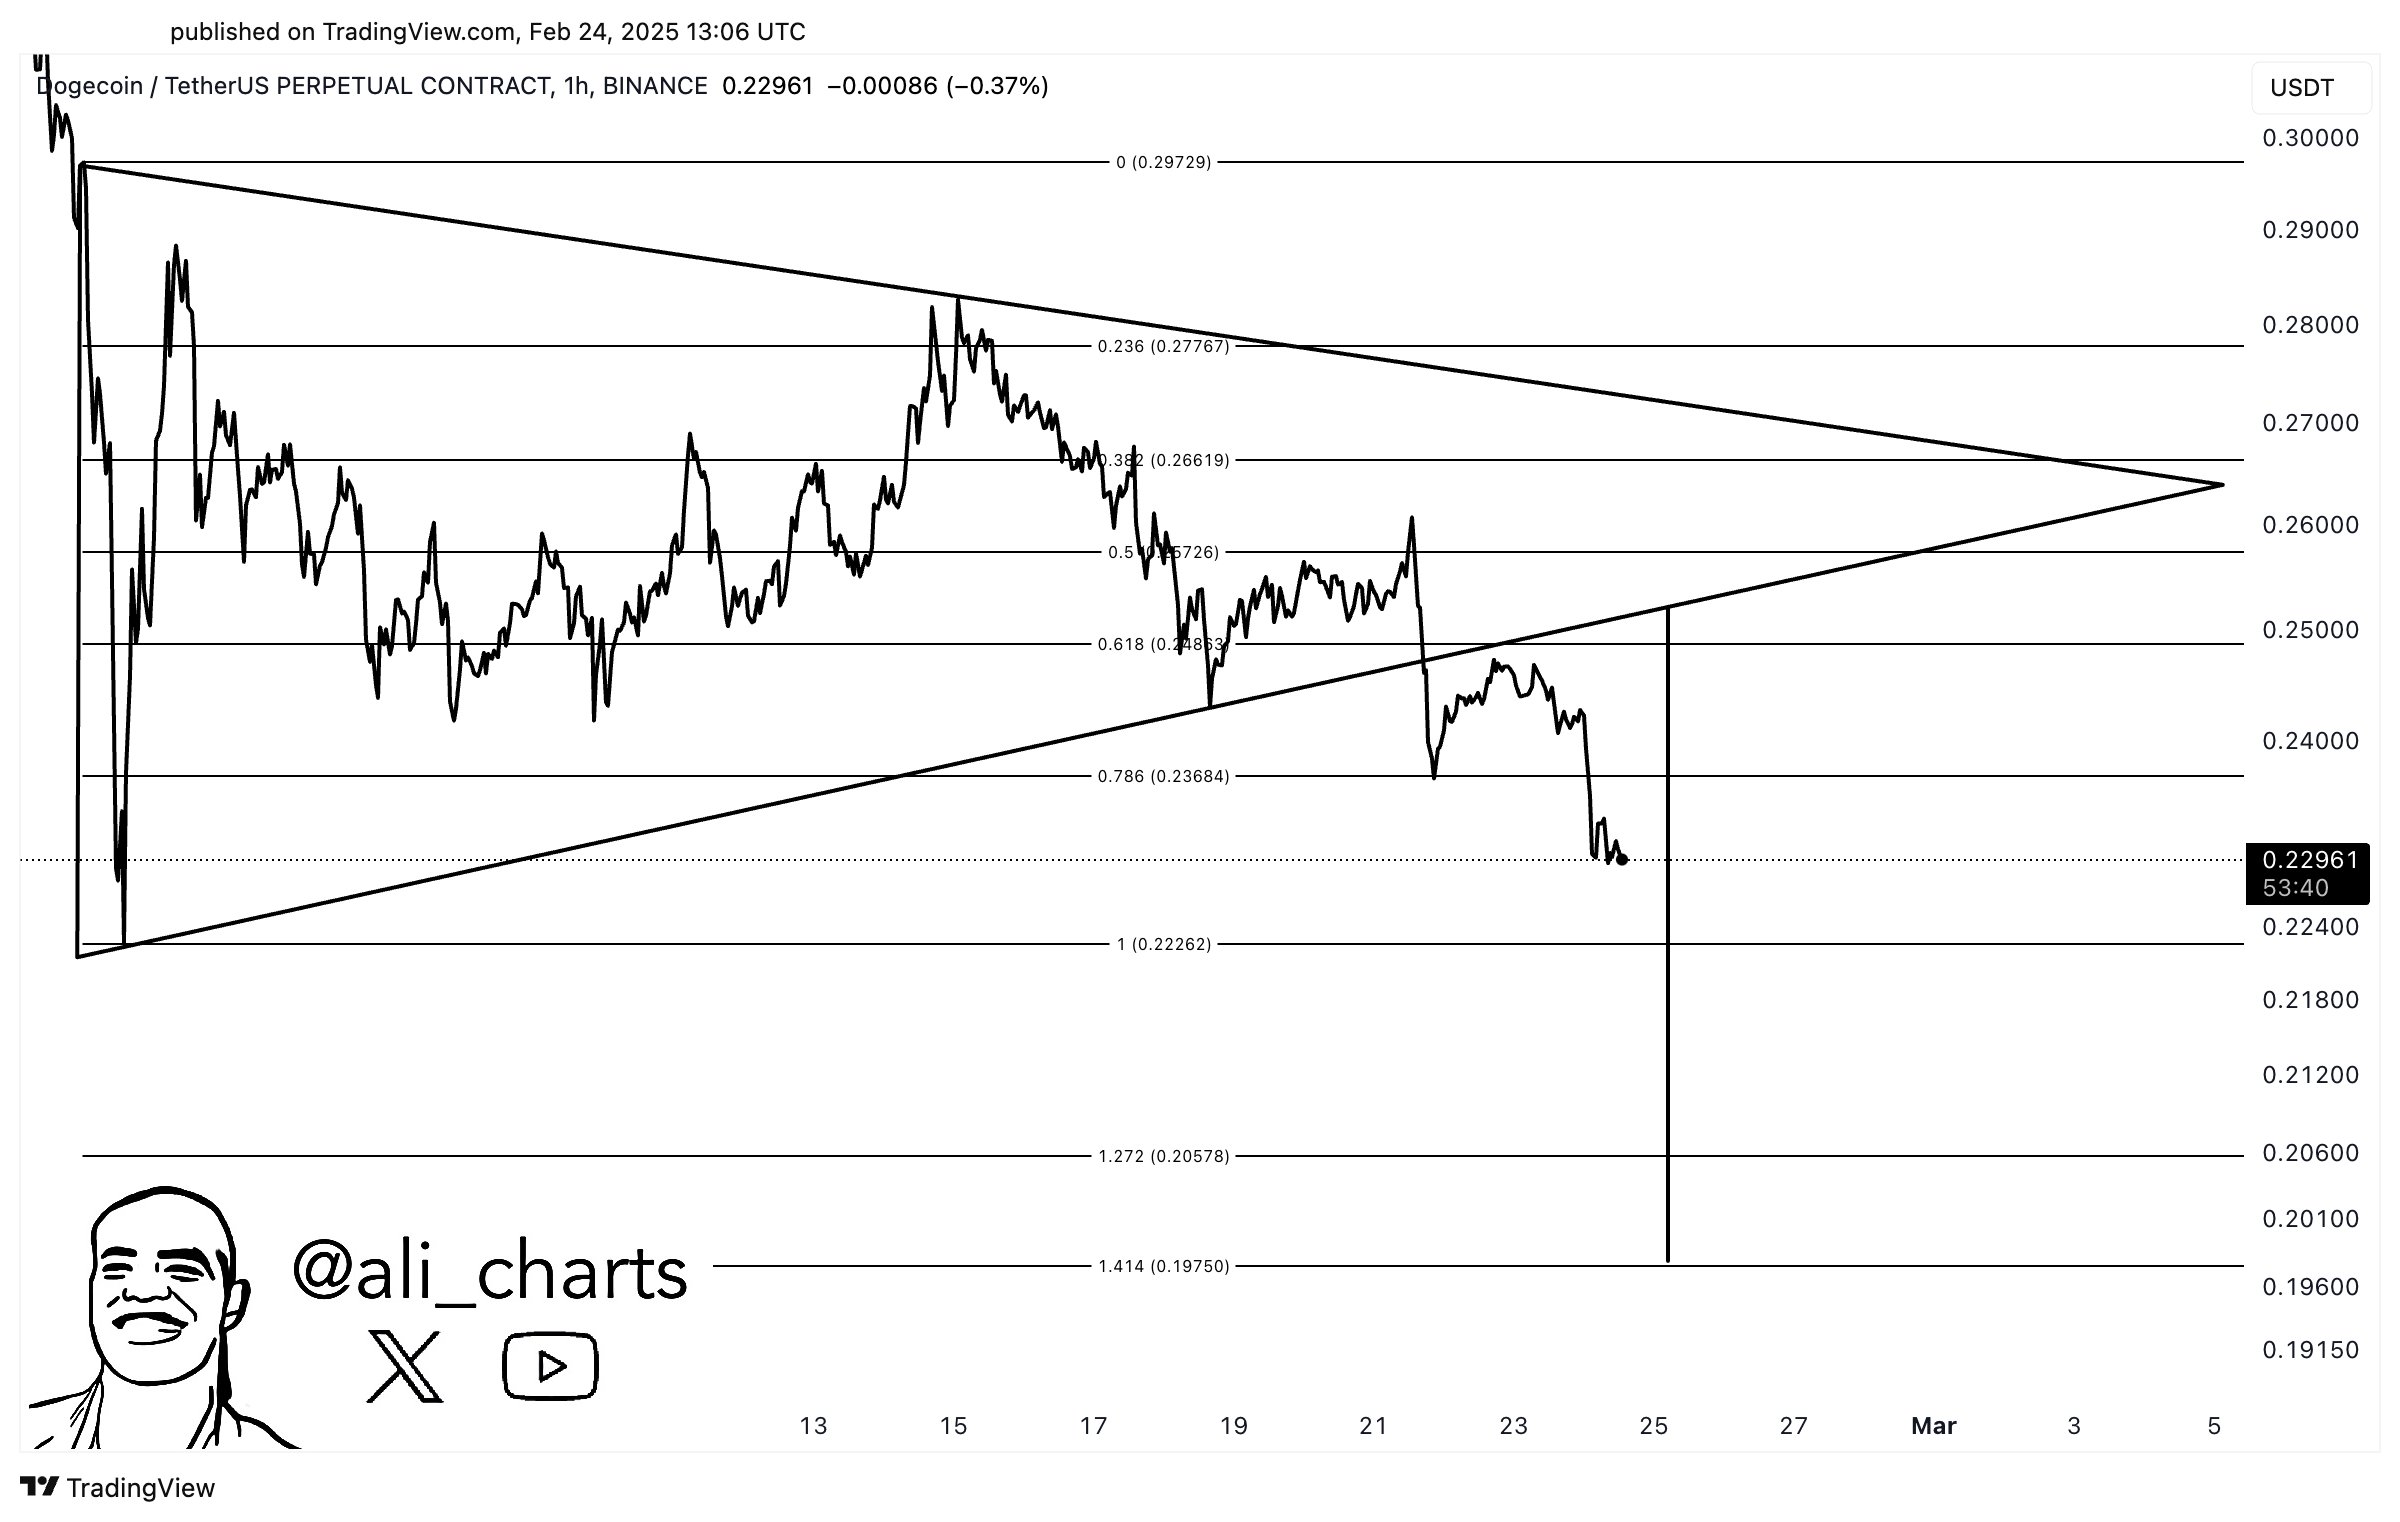
Source: Ali Charts
This invalidated the bullish target of $0.197. The 4-hour chart confirmed the bearish momentum, with Dogecoin dropping below critical support levels.
Fibonacci retracement analysis showed DOGE tested the 61.8% level at $0.218 before continuing downward.
The MACD indicator reflected a bearish sentiment, with the MACD line crossing below the signal line and histograms turning red, at press time.


Source: CoinGlass
Additionally, the Cumulative Volume Delta (CVD) on the 4-hour chart peaked at -7.64B, signaling heavy selling pressure.
These factors aligned with the triangle’s bearish breakout, negating the initial upside projection and reinforcing downward momentum.
Are traders losing confidence in DOGE?
DOGE’s spot netflow data over the last 24 hours, as shown in the 1-day chart, reflected substantial outflows totaling -$3.1M. The red bars dominated the chart, indicating strong selling pressure.


Source: CoinGlass
This pattern began in mid-February. On the 24th of February, a major outflow spike was observed, coinciding with DOGE’s price drop below $0.22.
The netflow chart mirrored price action as DOGE declined from $0.2511 to $0.2123. Consistent negative netflows suggested that investors exited positions, reducing buying support. This invalidated the initial bullish $0.197 target.
Without renewed buying interest, DOGE remains vulnerable to further downside movement.
Market stabilization or weakness?
Further, DOGE’s volatility data, tracked in the 4-hour chart, showed a declining trend over the past 24 hours. The Volatility Index dropped to 0.23155, indicating reduced price fluctuations.


Source: Coinglass
The chart displayed a steady decline in volatility, with DOGE stabilizing near $0.2123 after its sharp drop. This decline in volatility followed the symmetrical triangle’s breakdown, reinforcing bearish sentiment.
A lower volatility environment often signals that traders paused aggressive market activity, reducing the likelihood of sharp rebounds.
Combined with netflow trends and price action, DOGE’s reduced volatility confirms a bearish market stance. Traders are now focusing on potential support levels around $0.20.
What’s next for DOGE?
DOGE’s recent price action, declining netflows, and reduced volatility point to a bearish short-term outlook. The symmetrical triangle breakdown, ongoing outflows, and muted market activity suggest that downward pressure would likely persist.
If selling momentum continues, DOGE could test support at $0.20. Broader market trends and meme coin sentiment will determine whether a recovery follows.
Similar breakouts in altcoins led to extended corrections before finding strong support zones.
While DOGE’s long-term trajectory might still favor upside moves, the immediate market structure suggests further consolidation or declines before any significant recovery.
Source: https://ambcrypto.com/dogecoin-breakout-from-a-symmetrical-triangle-targeting-0-197/