Key Takeaways
MemeCore rebounded from $0.63 to $0.94 as buyers reclaimed Spot control and Open Interest nearly doubled. Can bulls sustain momentum beyond $1 to retest $1.14?
After retracing from its ATH of $1.14 on the 30th of August, MemeCore [M] rebounded from its $0.63 low. In fact, the token surged 36% to a local high of $0.94 before easing to $0.90 at press time.
Over the same period, MemeCore’s market cap climbed 35% to $895 million while daily Volume rose 17% to $48 million, pointing to steady inflows of capital.
But what’s behind MemeCore’s uptick?
From crash to comeback: Buyers step in!
Between the 28th and the 31st of August, buyers dominated the spot market. And then, sellers briefly took control on the 1st of September.
As such, the altcoin recorded a negative Buy-Sell Delta of -75k tokens. However, by press time, buyers regained control, finally displacing sellers.


Source: Coinalyze
According to Coinalyze, MemeCore saw 291.5k in Buy Volume compared to 257k in Sell Volume. This, in turn, produced a positive Buy-Sell Delta of 33k, a clear marker of renewed buyer dominance.
Futures demand surges
Interestingly, when we examine the Derivatives market, we determine that most of the recently deployed capital flowed into strategic positions.
According to CoinGlass, MemeCore’s Open Interest (OI) surged 94.4% to $83.8 million, at press time, while Volume jumped 235% to $1.4 billion.

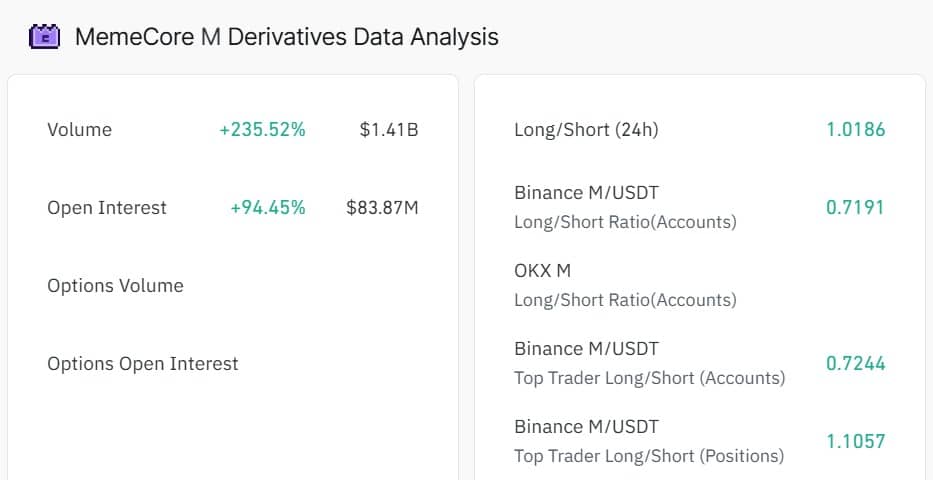
Source: CoinGlass
Typically, when OI and volume rise in tandem, it signals increased capital influx and participation in the Futures.
Meanwhile, the M token’s Long/Short Ratio climbed to 1.01, with longs making up 50.6% of contracts. Having said that, when longs dominate, it often reflects bullish bias among traders.
Profit-taking clouds the rally
As expected, after MemeCore recovered from the recent correction, holders jumped into the market to cash out.
According to CoinGlass, MemeCore recorded a positive Spot Netflow for four consecutive days. At press time, Netflow stood at $6.46K, confirming higher exchange inflows.


Source: CoinGlass
Historically, heavier inflows have preceded corrections or slowdowns, since they add selling pressure.
September test: Can M break $1.14?
According to AMBCrypto’s analysis, MemeCore’s rally aligned with surging Futures demand and renewed Spot-market buying.
As a result, the token’s Relative Strength Index (RSI) surged to 82.77, as of writing, hitting the overbought zone. Likewise, its Stochastic RSI surged to 100, also reaching overbought territory.

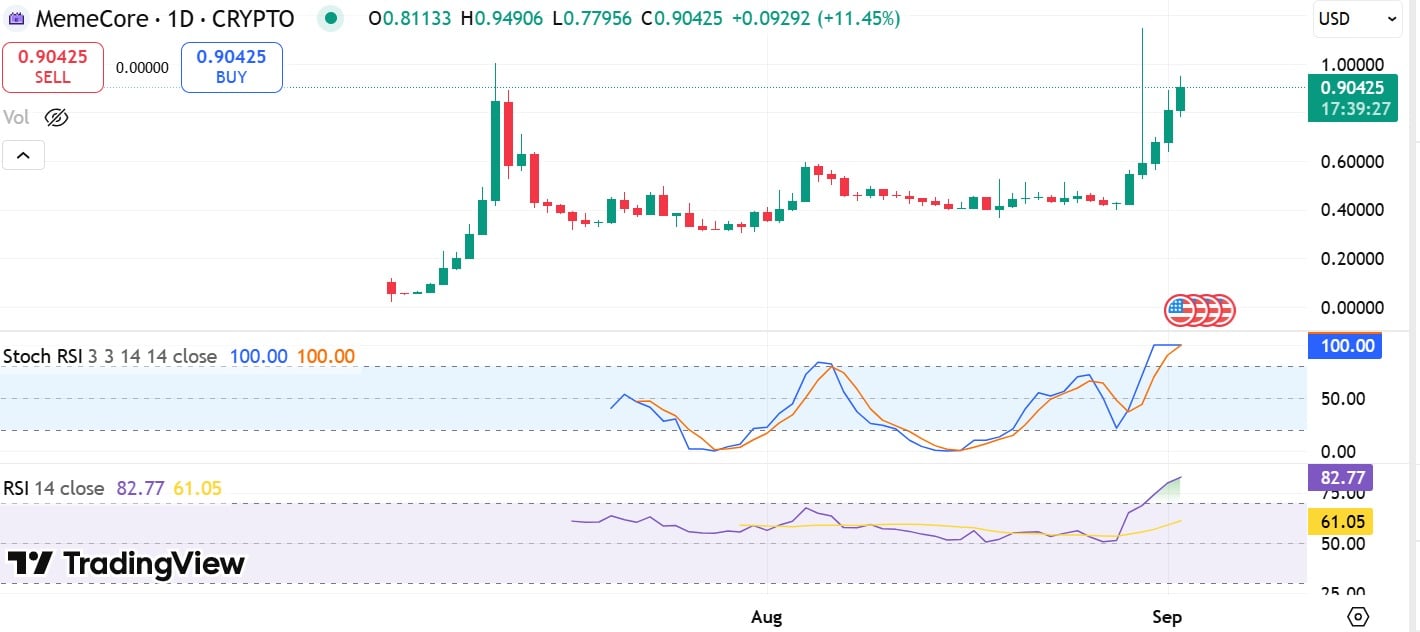
Source: TradingView
Typically, when momentum indicators hit the overbought zone, they signal buyer dominance but warn of looming volatility.
On top of that, profit-taking flows suggest near-term risks remain elevated.
Even so, if bulls maintain control across spot and derivatives, MemeCore could retest $1.14 and attempt a new ATH, given limited resistance above $1.
Conversely, if buyer exhaustion combines with profit-taking, the token may retrace toward $0.63 support.
Source: https://ambcrypto.com/decoding-memecores-36-surge-from-0-63-low-to-0-94-whats-next/