Key Takeaways
Why are Binance investors accumulating LINK right now?
LINK is trading at a 53% discount, and whale inflows—led by Binance wallets—have surged sharply.
What supports the possibility of a LINK rebound?
Strong taker buy volume, rising liquidity, and a Long/Short Ratio above 1 all reinforce a bullish recovery setup.
Investors are stepping back into the scene, accumulating Chainlink [LINK], even though the buying activity has yet to reflect on price.
Binance investors are leading this push, with the broader market joining the trend as traders pile their stablecoins into the asset. Here’s how the setup could play out for the token.
Binance whales step in
LINK has seen renewed inflows from whales in the past day—wallets categorized as controlling large liquidity in the market—as they increase their holdings.
In fact, this accumulation came from the top 10 wallets, pushing the monthly average inflow to 3,150 LINK—roughly $42,000 at press time.
This accumulation trend comes as LINK trades 53% below its August high, with investors viewing the discount as an opportunity to re-enter the market.

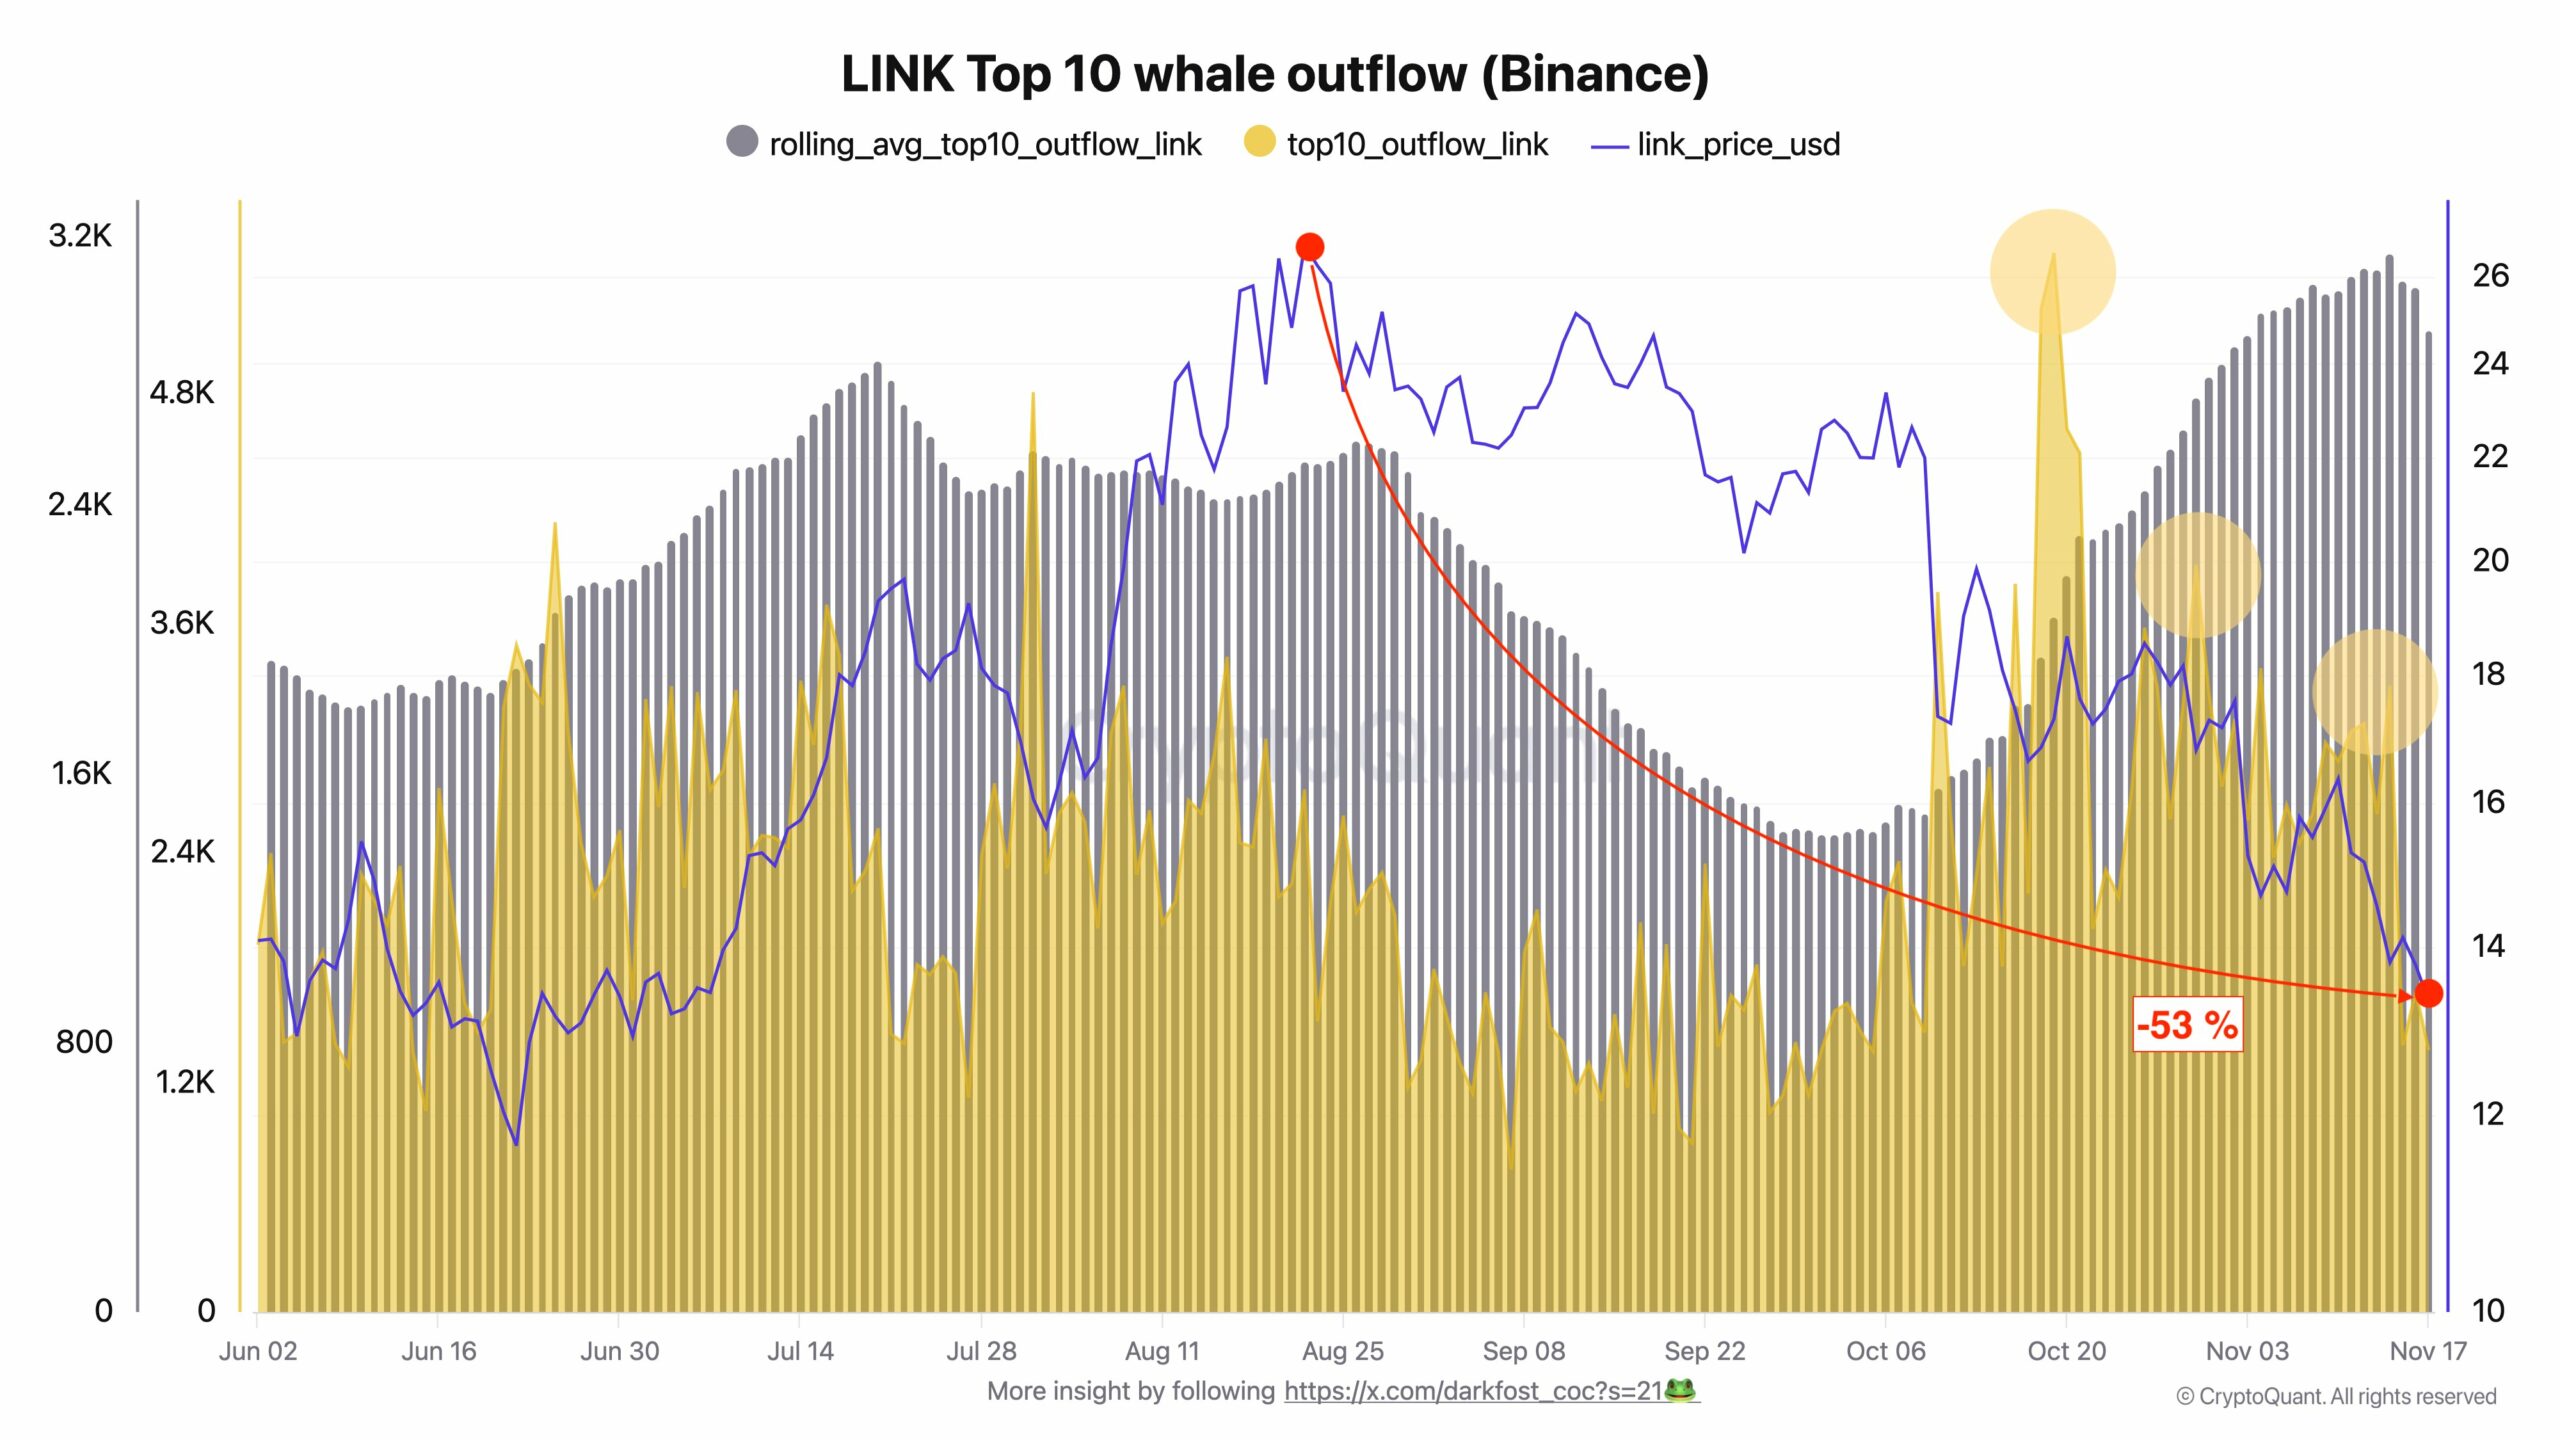
Source: CryptoQuant
In the derivatives market, liquidity has also strengthened, with traders positioning for an upside move.
The Taker Buy Sell Volume on Binance shows more taker buyers stepping in, posting a reading of 2.21—suggesting buyers are gaining dominance.
Broader market in alignment
The broader market has gradually aligned with this sentiment, with on-chain and exchange activity showing that investors are accumulating across platforms.
In the spot market, for example, investors have spent about $11.75 million purchasing LINK since the week began.
Such significant capital inflows indicate that buying extends across multiple exchanges—not just Binance.


Source: CoinGlass
Meanwhile, the Long/Short Ratio in the derivatives market continues to hold above 1, now at 1.024.
A ratio above 1 implies that most of the trading volume comes from the buy side as traders increase their exposure. If this continues, LINK could retrace its path from the August lows and move toward recovery.
A clear road ahead
LINK shows a clear path to a potential rally, given its position relative to distributed liquidity clusters. CoinGlass data indicates a higher concentration of liquidity clusters above the current price than below it.
Naturally, price tends to gravitate toward areas with greater liquidity.


Source: CoinGlass
In this case, the upper range holds more liquidity, implying that price could be pulled upward soon, especially if momentum continues to build.
However, whales, retail traders, and derivatives investors will play decisive roles in determining whether LINK can secure an upward swing.
Source: https://ambcrypto.com/chainlinks-liquidity-map-hints-at-upside-are-buyers-ready-to-push/