- SHIB consolidates near $0.00001080–$0.00001100, signaling potential rebound zones.
- Key resistance at $0.00001178 aligns with 50-EMA, testing bullish breakout momentum.
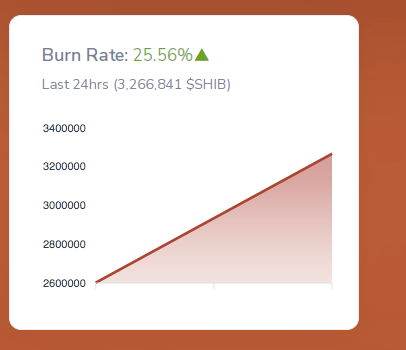
- Rising burn rate and lower leverage highlight long-term scarcity and accumulation trends.
Shiba Inu (SHIB) is showing signs of stabilization after recent volatility, with the token consolidating around the $0.00001080–$0.00001100 range. This zone has become a key decision area as traders weigh the potential for a short-term rebound.
Despite earlier corrections, SHIB continues to trade near major moving averages, signaling that market participants are still assessing whether the consolidation phase could evolve into a recovery. Consequently, the next directional move is likely to depend on momentum strength and liquidity near critical Fibonacci levels.
Consolidation Around Key Fibonacci Levels
The 4-hour chart indicates that SHIB retraced in the 0.5 and 0.618 Fibonacci regions, indicating that buyers attempt to protect their positions. At 0.00001178 there is a 0.618 retracement that coincides with the 50-EMA providing a significant resistance point. Any breakout beyond this would spell entry into the realms of $0.00001214 and potentially, the $0.00001300 which would mean the resurgence of the bullish momentum.
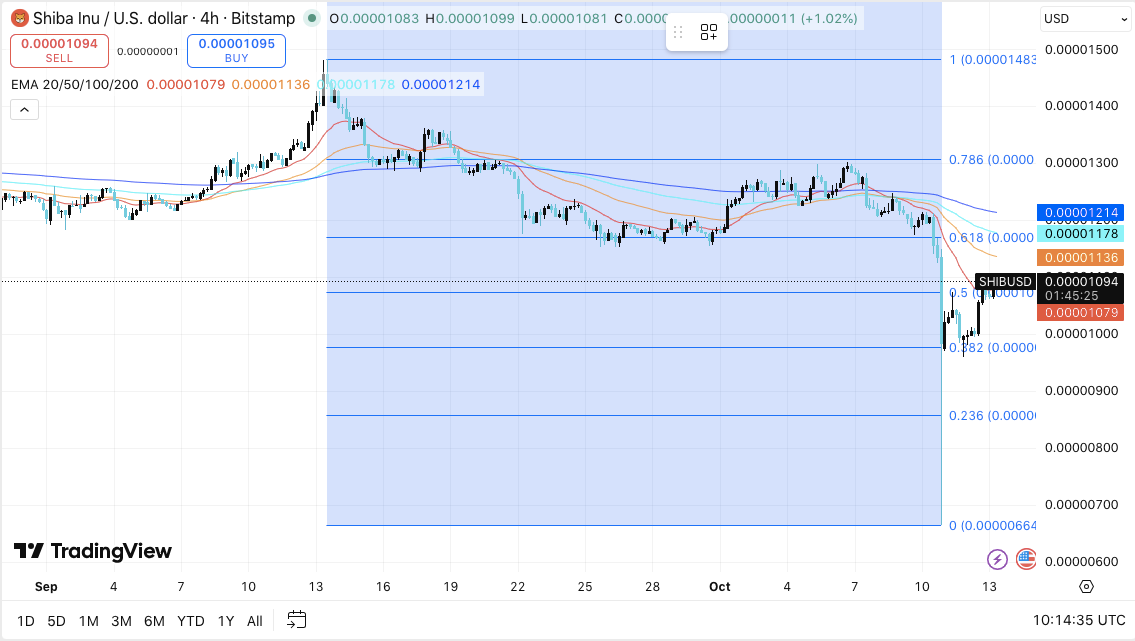

On the downside, short-term support is around the 0.382 level at $0.00001010. If this level is not maintained, further drops towards $0.00000982 and $0.00000900 may still be possible. Additionally, the RSI remains in the neutral zone, suggesting a balanced market sentiment while traders await a more definitive signal.
Related: Dogecoin Price Prediction: DOGE Eyes V-Shaped Rebound As U.S.–China Rhetoric Calms Markets
Futures and Liquidation Data Indicate Accumulation
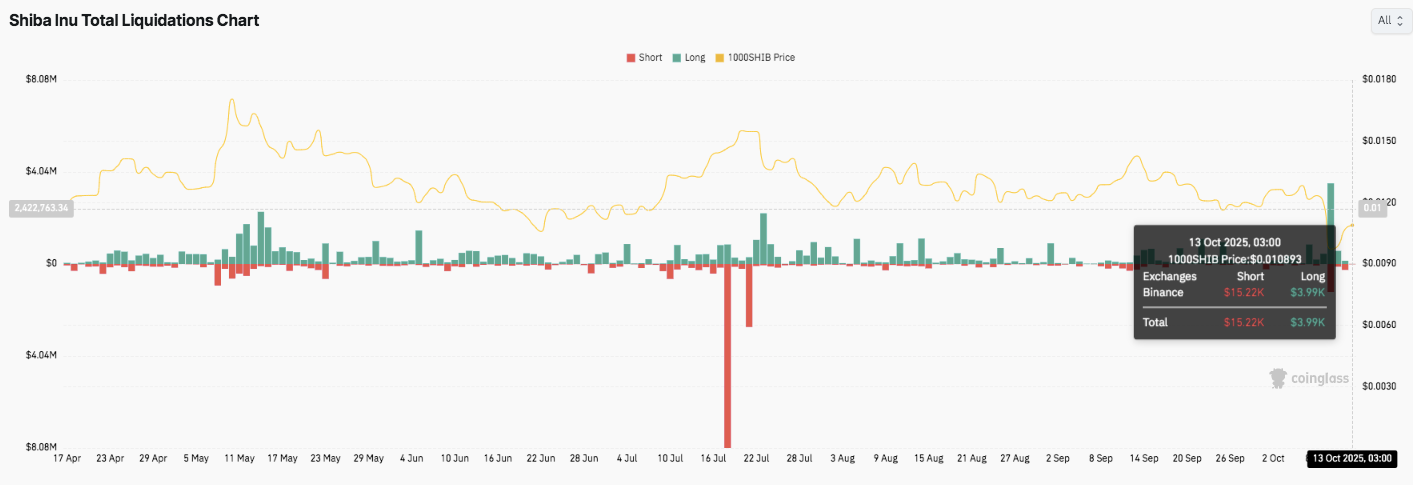

Data from SHIB’s derivatives market shows a spike in liquidation activity, highlighting heightened inflow and outflow volatility. On October 13, short liquidations totaled $15,220 compared to $3,990 in long positions. This pattern suggests bears dominated early in the session, but the rebound in long liquidations shows renewed buying efforts as the token tested the $0.01089 zone.
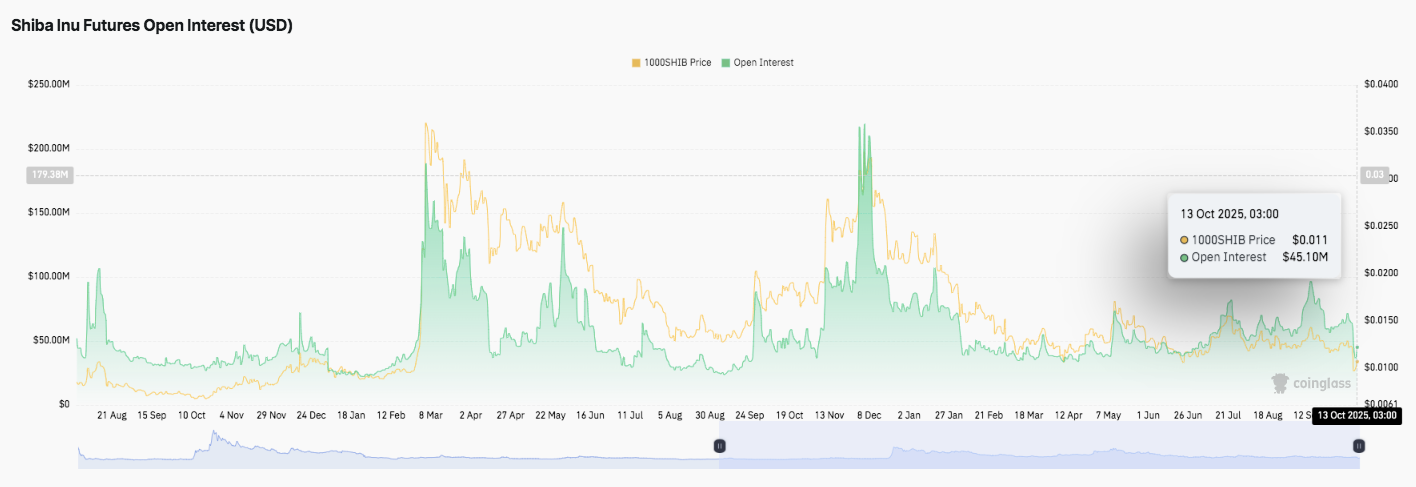

Meanwhile, open interest has declined from its March peak of over $200 million to $45.1 million by mid-October, reflecting reduced leverage exposure. Still, sustained activity suggests that traders remain engaged. If open interest rises alongside price recovery, SHIB could experience a short-term volatility surge as speculative interest returns.
Burn Rate and Supply Reduction Strengthen Long-Term View

Shiba Inu’s deflationary design continues to play a vital role in its tokenomics. Out of the total 999.98 trillion supply, about 410.75 trillion SHIB have been permanently burned, leaving 589.24 trillion in existence. Of this, 4.49 trillion are locked as xSHIB in staking contracts.
The network’s burn rate jumped by over 25% in the past 24 hours, with 3.26 million tokens destroyed. Hence, while short-term sentiment fluctuates, consistent token reduction supports the project’s long-term scarcity narrative. This ongoing supply contraction, combined with market stabilization, positions SHIB for potential strength if broader crypto momentum improves.
Related: Chainlink Price Prediction: LINK Recovery Faces Key Resistance
Technical Outlook for Shiba Inu (SHIB) Price
Shiba Inu (SHIB) continues to trade in a tight consolidation range, with price action hovering between $0.00001080 and $0.00001100. The structure suggests that SHIB is building energy for a potential breakout after an extended retracement phase. Significantly, the price has tested the mid-range of its Fibonacci retracement zone, where both the 100-EMA and 200-EMA are acting as resistance barriers.
Upside levels are clearly defined, with the 0.618 Fibonacci level at $0.00001178 marking the first hurdle for bulls. A breakout above this threshold could drive the token toward $0.00001214 and later $0.00001300. If momentum strengthens beyond $0.00001364 the 200-day EMA buyers may attempt a move toward $0.00001472 and $0.00001600. These levels would confirm a short-term reversal and re-establish medium-term bullish momentum.
Downside levels remain sensitive, with $0.00001010 serving as the immediate defense line. Failure to hold this zone could lead to a drop toward $0.00000982 and $0.00000900. The 0.382 Fibonacci level supports this base, suggesting traders are accumulating within the lower band.
Technically, SHIB appears to be compressing within a descending wedge, a pattern often preceding volatility expansion. RSI readings remain neutral, implying market indecision, while the burn-driven deflationary mechanism continues to improve long-term fundamentals.
Outlook for the Coming Weeks
The trend in October will be determined by whether Shiba Inu can reclaim the $0.00001178- $0.00001214 range. The continued purchasing pressure around these grounds may trigger a recovery to the $0.00001300-0.00001472 area. Nonetheless a decline of less than $0.00001000 can strengthen a bearish run to $0.00000900.
Related: XRP Price Prediction: ETF Countdown Sparks Renewed Optimism
With the accumulation of inflows, decreasing leverage, and increasing burn rate, SHIB configuration indicates a consolidation-to-breakout structure. Therefore, traders are keenly watching whether the bulls will take over and trigger the next erectal wave as the volatility narrows before mid-October.
Disclaimer: The information presented in this article is for informational and educational purposes only. The article does not constitute financial advice or advice of any kind. Coin Edition is not responsible for any losses incurred as a result of the utilization of content, products, or services mentioned. Readers are advised to exercise caution before taking any action related to the company.