Cardano price increased over the past day as the upgrade nears completion. Speculation abounded in the crypto space after rumors of a potential meeting between Elon Musk and the Cardano founder went viral. The price of Cardano shows a bullish tendency, but volume is needed for the inbound rally. Will the US CPI data provide the required volatility?
Cardano Price Gains Amid Positive CPI Data
The United States Bureau of Labor Statistics has released the latest measure of the Consumer Price Index (CPI) data. This economic metric, which shows the United States inflation rate, is closely tied to Bitcoin’s short-term price movements. BTC hovered around $61,100 during the CPI data release, up 3.65% in the last 24 hours.
The market expected the CPI to be 3% YoY, matching June’s records. MoM inflation was expected to rise slightly by 0.2%, higher than June’s 0.1%. However, the headline CPI came in at 2.9%, lower than expected, with the MoM inflation rate maintaining at 0.2%.
The report likely seals the case for the Federal Reserve to begin cutting interest rates at its next meeting, September 17–18. This may translate into a win for Bitcoin, as Fed Chair Jerome Powell has already signaled that a rate cut is probable in September.
The Cardano price increased by 1.9% over the last 24 hours, trading at $0.3422. With eased inflation, the bitcoin price may rally above $62,000, pulling the rest of the market up with it. Hence, Cardano may get the volume it needs to rise higher.
Cardano Network Growing, But Whales Leaving
On-chain data from IntoTheBlock reveals that the Cardano network is growing. Over the last 24 hours, the daily active addresses, which is the number of addresses that made a transaction in the past day, increased from 23,510 to 25,510, an uptick of 8.5%. This suggests that news investors joined the Cardano ecosystem, a positive indicator of the Cardano price.

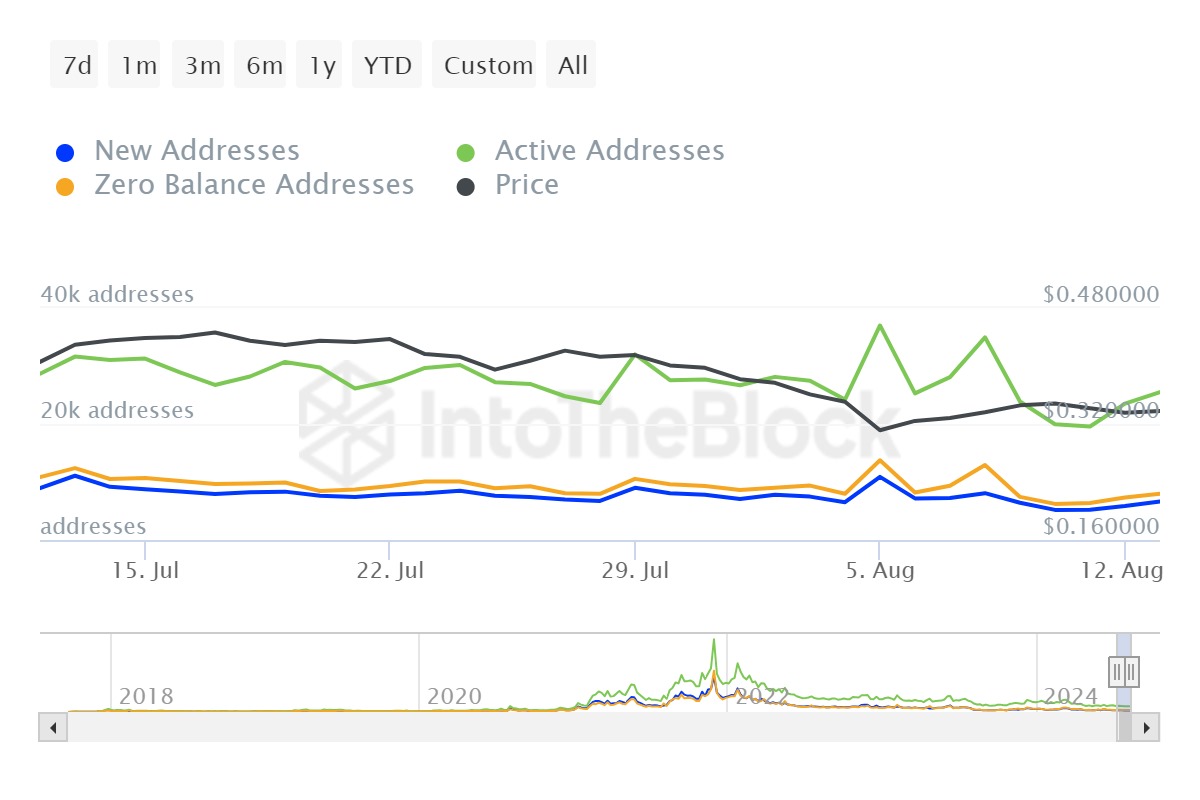
The New Adoption Rate (NAR), which shows the percentage of new addresses making their first transaction out of all active addresses on a given day, also increased from 24.94% to 26.05%. This indicates that newcomers comprised 26% of all on-chain activity on Cardano.


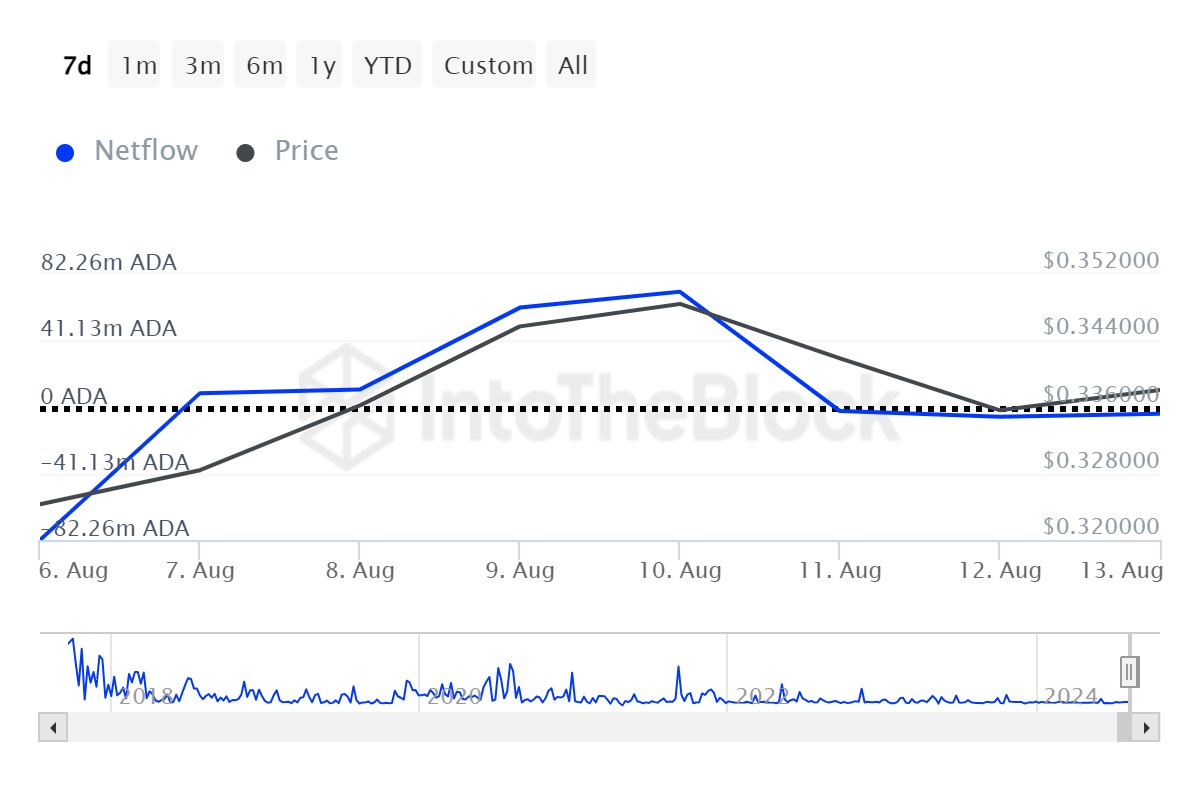
Conversely, as newcomers join the network, whales seem to be leaving. According to IntoTheBlock, whale activity dropped 99.77% over the last seven days, indicating a lack of interest in participating in the network.


Moreover, these large holders are cashing out their Cardano as the large holder netflow dropped into the negative zone between August 11 and 13. So far, the whales have offloaded $4.32 million of ADA in the last three days.

ADA technical analysis reveals a potential reason why whales leave the network.
ADA Price Uncertainty Chasing Away Whales?
The ADA price is currently trending downward since it is below the 50-day and 200-day exponential moving averages (EMA).
The asset faces some resistance at $0.3432, $0.3600, and $0.3743. On the lower side, support holds the price around $0.3200, a level that has been tested multiple times and remained strong.
The Cardano price chart shows a Symmetrical Triangle pattern, typically indicating a potential upward or downward breakout. ADA daily trading volume appears to be relatively low, which is typical before a significant breakout. A volume spike may confirm any breakout from the triangle.
Cardano’s open interest (OI) increased in the last 24 hours per Coinalyze, signaling bullish sentiment from investors. The Chaikin Money Flow (CMF) indicator is also positive, signaling a marginally bullish sentiment.


The Moving Average Convergence/Divergence (MACD) indicator just flashed a bullish cross, confirming that bulls may soon take over the ADA price action. The Relative Strength Index is neutral at 51, suggesting that the market is waiting for a clear direction.


If ADA price makes a clear break above the symmetrical triangle, it may signal market strength and prompt whales to return. Cardano may surge higher above $0.37, and the overall trend will shift to bullish.
Frequently Asked Questions (FAQs)
Cardano’s price movement is currently influenced by multiple factors: the upcoming consumer price index (CPI) data release, network growth and whale activity.
The US CPI data, which measures inflation, is closely watched by investors as it can influence the overall market sentiment. If the CPI data meets or exceeds expectations, it may boost Bitcoin’s price, potentially leading to a broader market rally that could benefit Cardano as well.
The decline in whale activity may be due to uncertainty in ADA’s price trend, as it struggles to break above key resistance levels.
Related Articles
Evans Karanja
Evans Karanja is a content writer and scriptwriter with a focus on crypto, blockchain, and video gaming. He has worked with various startups in the past, helping them create engaging and high-quality content that captures the essence of their brand. Evans is also an avid crypto trader and investor, and he believes that blockchain will revolutionize many industries in the years to come. When he is not writing, you can find him playing video games or chasing waterfalls.
Disclaimer: The presented content may include the personal opinion of the author and is subject to market condition. Do your market research before investing in cryptocurrencies. The author or the publication does not hold any responsibility for your personal financial loss.
Source: https://coingape.com/markets/can-cardano-price-trigger-10-breakout-rally-ahead-of-us-cpi/
✓ Share: