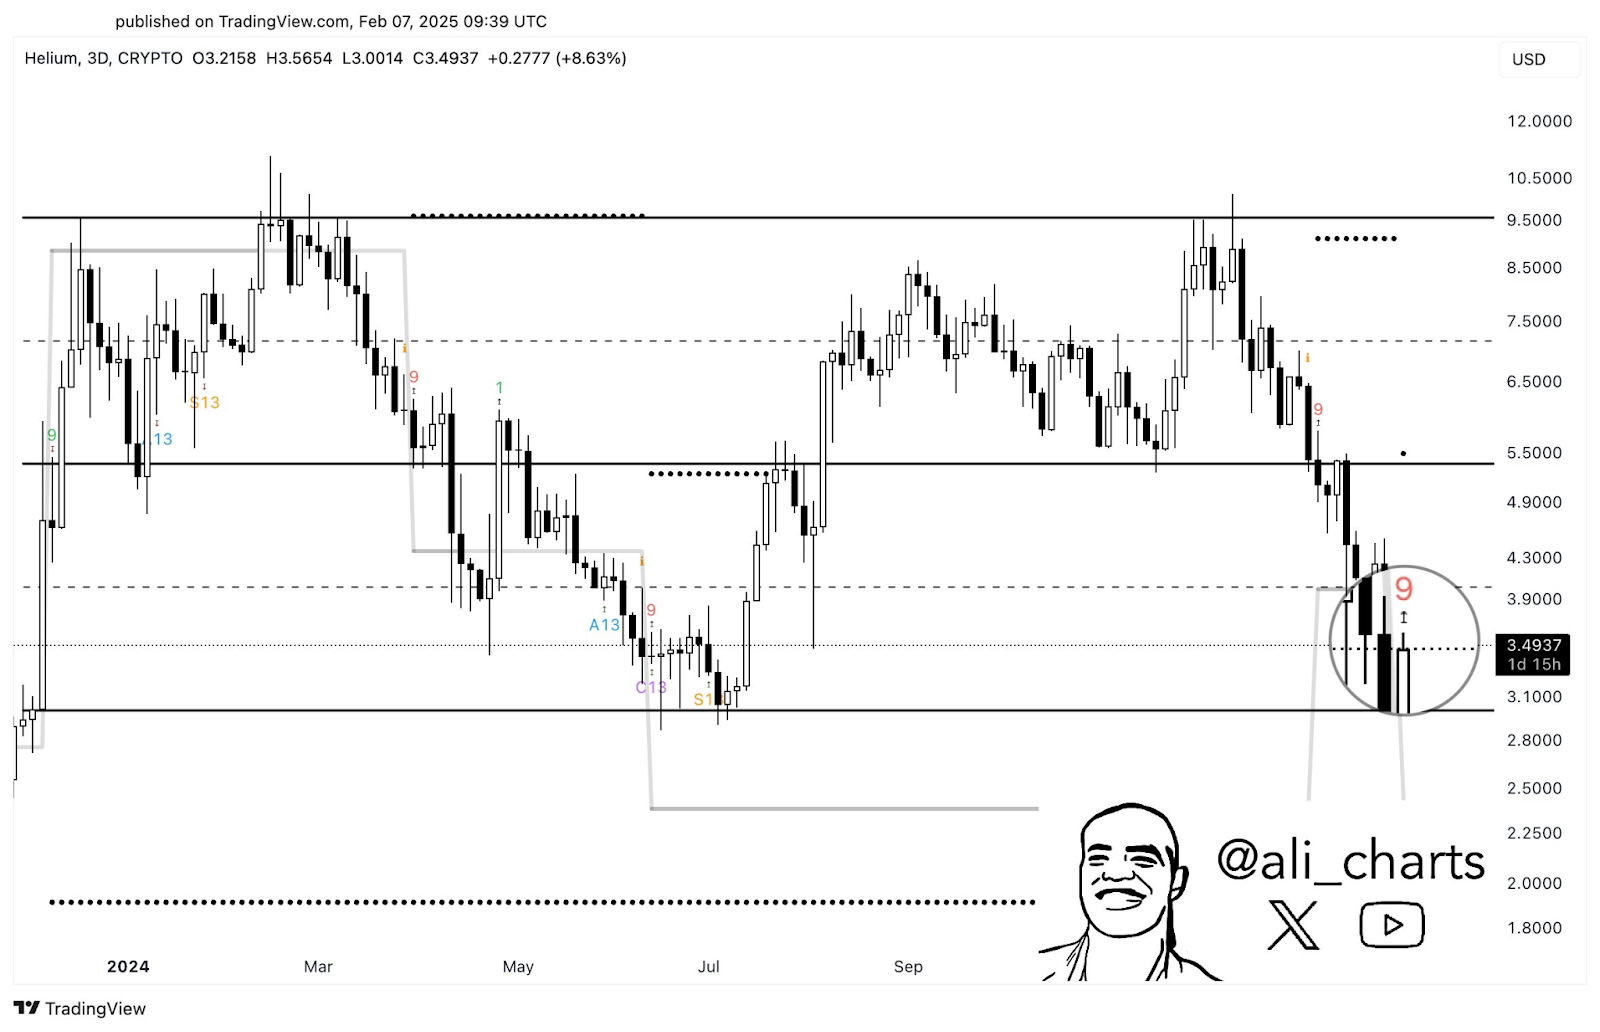
- Helium’s TD Sequential buy signal suggests a possible bullish reversal from $3.10.
- Inflows above $1.5M have historically triggered price rebounds and accumulation.
- RSI near oversold at 33.11 hints at a potential HNT trend reversal above 40.
Helium (HNT) is currently trading near a key support level of $3.10, which is the lower boundary of a parallel channel. Analyst Ali Martinez notes that the TD Sequential indicator has given a “9” buy signal on the 3-day chart. Historically, similar signals at important price levels have led to strong upward moves.
If the support holds, HNT could see a notable price recovery, with potential resistance at $4.90 and possibly even extending toward $7.50. But, a breakdown below $3.10 might lead to further declines, with the next major support at $2.20.

HNT’s Recent Market Behavior
HNT is currently priced at $3.34, reflecting a 5.92% increase in the last 24 hours. Despite this short-term gain, the token has dropped 24.38% over the past week. Its 24-hour trading volume stands at $14.81 million, with a circulating supply of 180 million HNT.
This gives Helium a market capitalization of approximately $591.75 million. The price movements lately show ongoing market uncertainty, with traders closely watching support and resistance levels.
Analyzing HNT On-Chain: Inflows, Outflows, Key Trends
The HNT inflow/outflow chart shows large fluctuations, with a critical threshold around $1.5 million. Historically, inflows above this level, as seen in September and December, have lined up with price rebounds and accumulation phases.
Conversely, outflows exceeding $1.5 million, such as in mid-August and late January, have triggered substantial price declines. Neutral flow levels often indicate market consolidation, leading to limited price movement.
Related: Bittensor (TAO), Helium (HNT), Solana (SOL) Lead Market Bounce
When inflows exceed $1 million, they tend to support price stability, while similar outflows increase downward trends. The $1 million threshold is a key point for potential trend reversals.
Technical Indicators: RSI and MACD Analysis
The Relative Strength Index (RSI) is currently at 33.11, nearing oversold territory at 30. This indicates strong selling pressure but also hints at a possible reversal if the RSI moves above 40.
Also, the MACD indicator shows the MACD line slightly positive at 0.011, with a recent bullish crossover against the signal line. This suggests a weakening of the bearish trend and potential short-term upside momentum.
Helium’s Price Potential: February 2025 Outlook
Coincodex market projections for February 2025 suggest a possible 9.78% price increase, with HNT expected to average $3.62.
Related: Helium (HNT) Price Prediction 2024-2030: Will HNT Price Hit $10 Soon?
Price fluctuations could range between $3.33 and $4.25, offering a potential return of 28.99% from the current level. If bullish momentum grows, HNT could test key resistance zones, further strengthening its long-term outlook.
Disclaimer: The information presented in this article is for informational and educational purposes only. The article does not constitute financial advice or advice of any kind. Coin Edition is not responsible for any losses incurred as a result of the utilization of content, products, or services mentioned. Readers are advised to exercise caution before taking any action related to the company.
Source: https://coinedition.com/helium-hnt-shows-buy-signal-targets-key-resistance/