- BONK broke out of its previous price structure, potentially setting up a move towards $0.000009
- Memecoin’s perpetual futures to spot volume ratio chart provided further insights into market activity
The cryptocurrency market saw significant price volatility recently, with BONK drawing attention from investors due to its price structure break. In fact, such was its movement that the crypto might potentially be setting up for a move towards $0.000009 on the charts.
Emergence of a bullish trend
BONK‘s MACD indicator flashed a clear signal of momentum shifting in favor of buyers. As can be seen in the attached chart, the MACD line crossed above the sSgnal line, signaling a bullish crossover for the memecoin’s market.


Source: CoinGlass
Such a shift typically precedes price hikes as buying momentum usually accelerates too. This crossover, combined with the structural break in BONK’s price, might be in line with the prediction that the memecoin could move towards $0.000009.
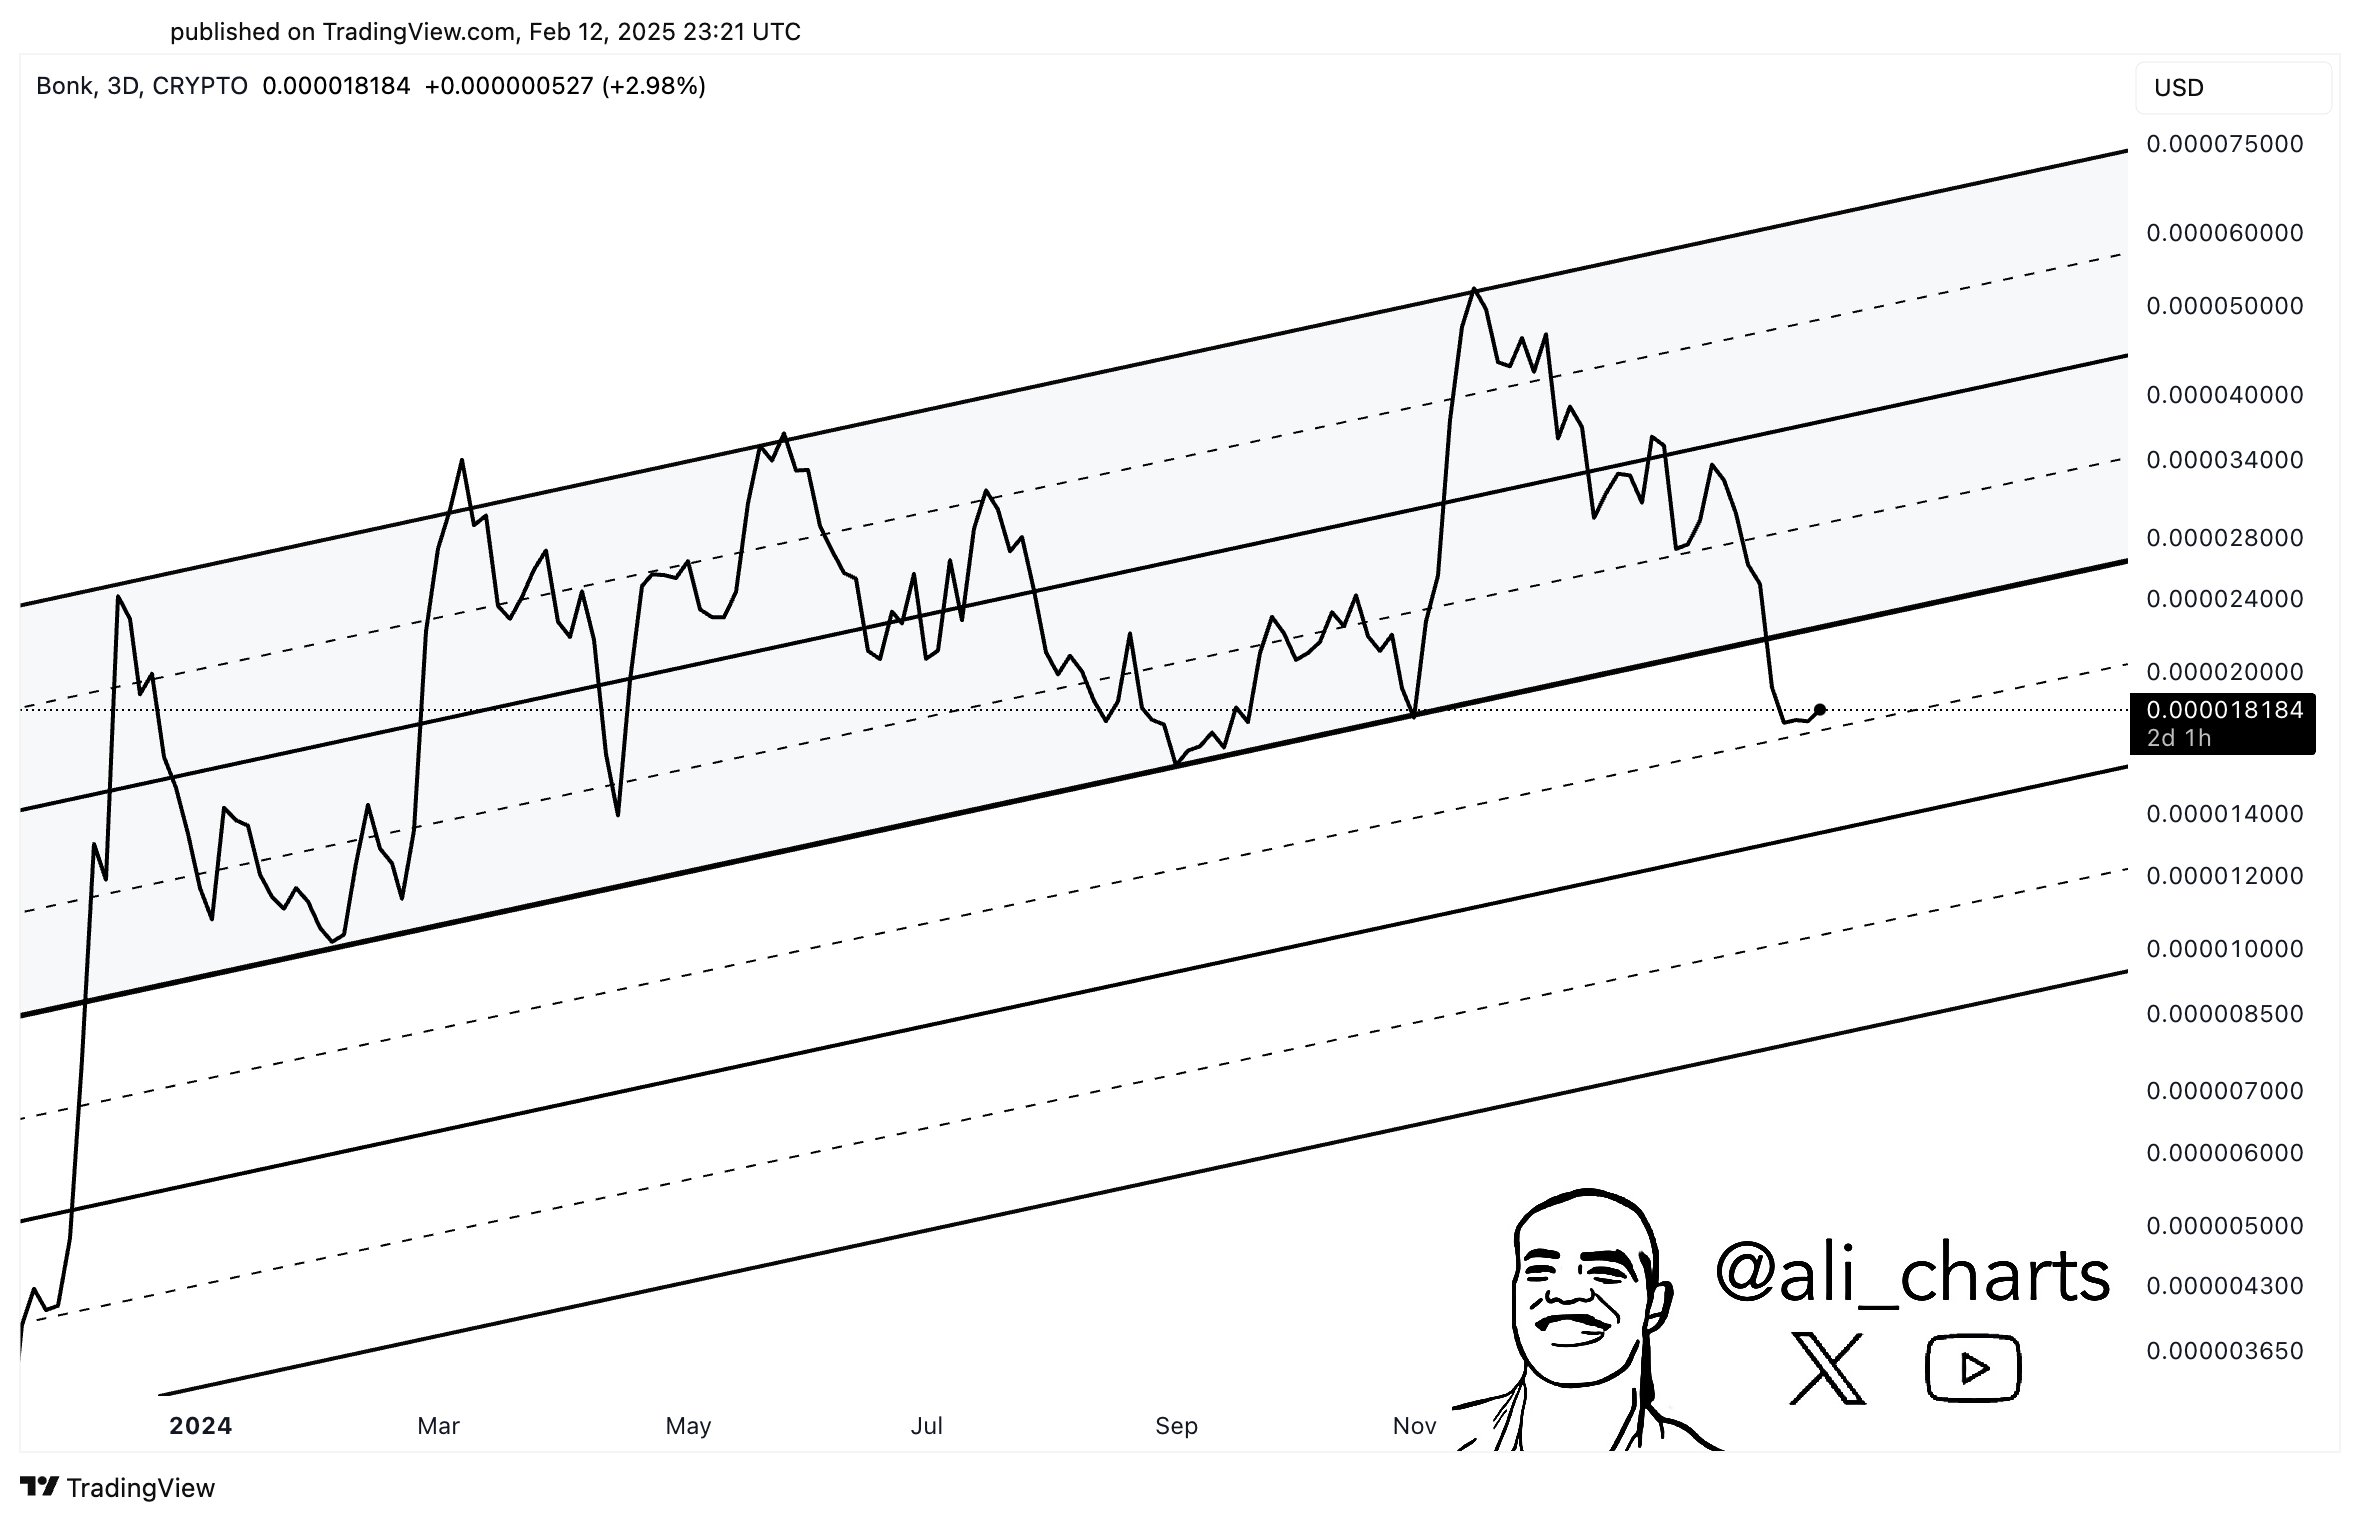

Source: X
The memecoin’s growing momentum is a sign that if the trend continues, BONK could see some upside and soon, target a higher level on the charts.
How market forces could push BONK higher
The total liquidations chart for BONK shed light on market sentiment and potential price impact too. In fact, a significant hike in both long and short liquidations was seen recently, with short liquidations surging after the memecoin’s price structure broke.
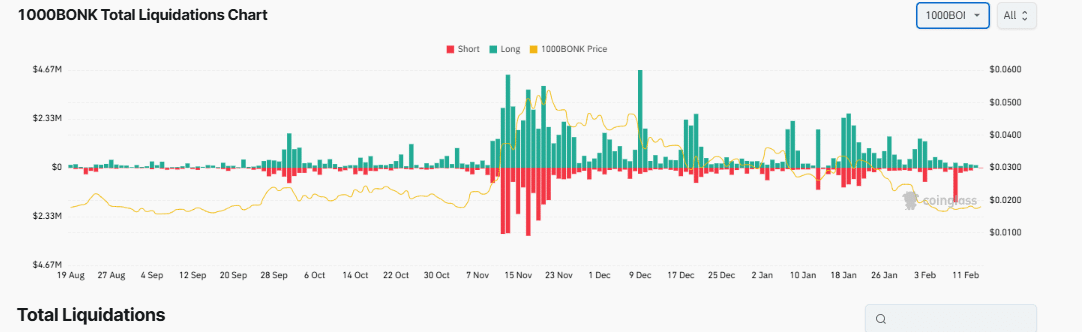

Source: Coinglass
Such an uptick in short liquidations can often result in a short squeeze, where forced closures of bearish positions fuel upward price pressure on the charts.
According to AMBCrypto’s analysis, as these short positions close, buying activity will surge and boost BONK’s price. The aforementioned liquidation pattern seemed to reinforce this bullish sentiment, while also supporting expectations of a hike to $0.000009.
Speculative activity points to bigger moves
Finally, the perpetual futures to spot volume ratio chart for BONK registered an uptick. This hinted at greater interest in futures trading, often linked to speculative trading activity.
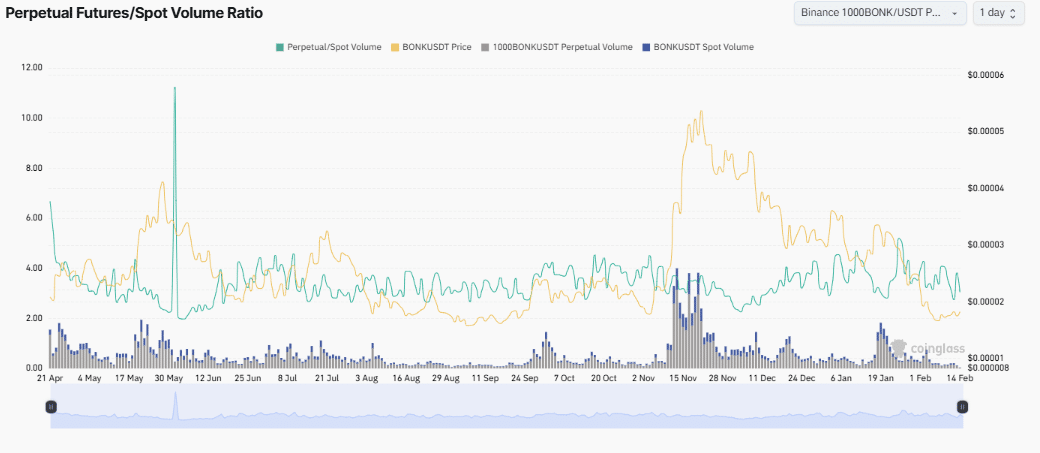

Source: CoinGlass
This hike in futures trading seemed to be in line with the time when the price structure broke – A sign of heightened anticipation. Traders may be positioning themselves for a price surge, utilizing leverage to capitalize on the expected shift.
Underlying forces supporting BONK
The bid and ask delta, along with the Open Interest, offered additional insights into the market depth and trader sentiment. The OI chart highlighted consistent activity, with occasional spikes pointing to sustained interest in BONK’s futures contracts.
Meanwhile, the bid-ask delta revealed periods where buying interest has exceeded selling interest, suggesting underlying bullish sentiment. These signals, when combined with the structural break in the price and other indicators, alluded to a favorable environment for BONK ahead.
Source: https://ambcrypto.com/bonk-price-prediction-how-these-underlying-forces-could-affect-memecoin/