- Cardano’s ADA stagnated in a tight range between $0.34 and $0.36 this month
- ADA previously registered a positive shift in momentum when it formed a higher high in late September
Bitcoin recorded minor gains on Thursday, reclaiming $68k after slipping to a weekly low of $66,300 on 23 October in a correction move that ignited selling in altcoins. Cardano (ADA) stood out among the top losers in the midweek session, with bullish speculators suffering another blow in their pursuit of the $0.40 psychological target.
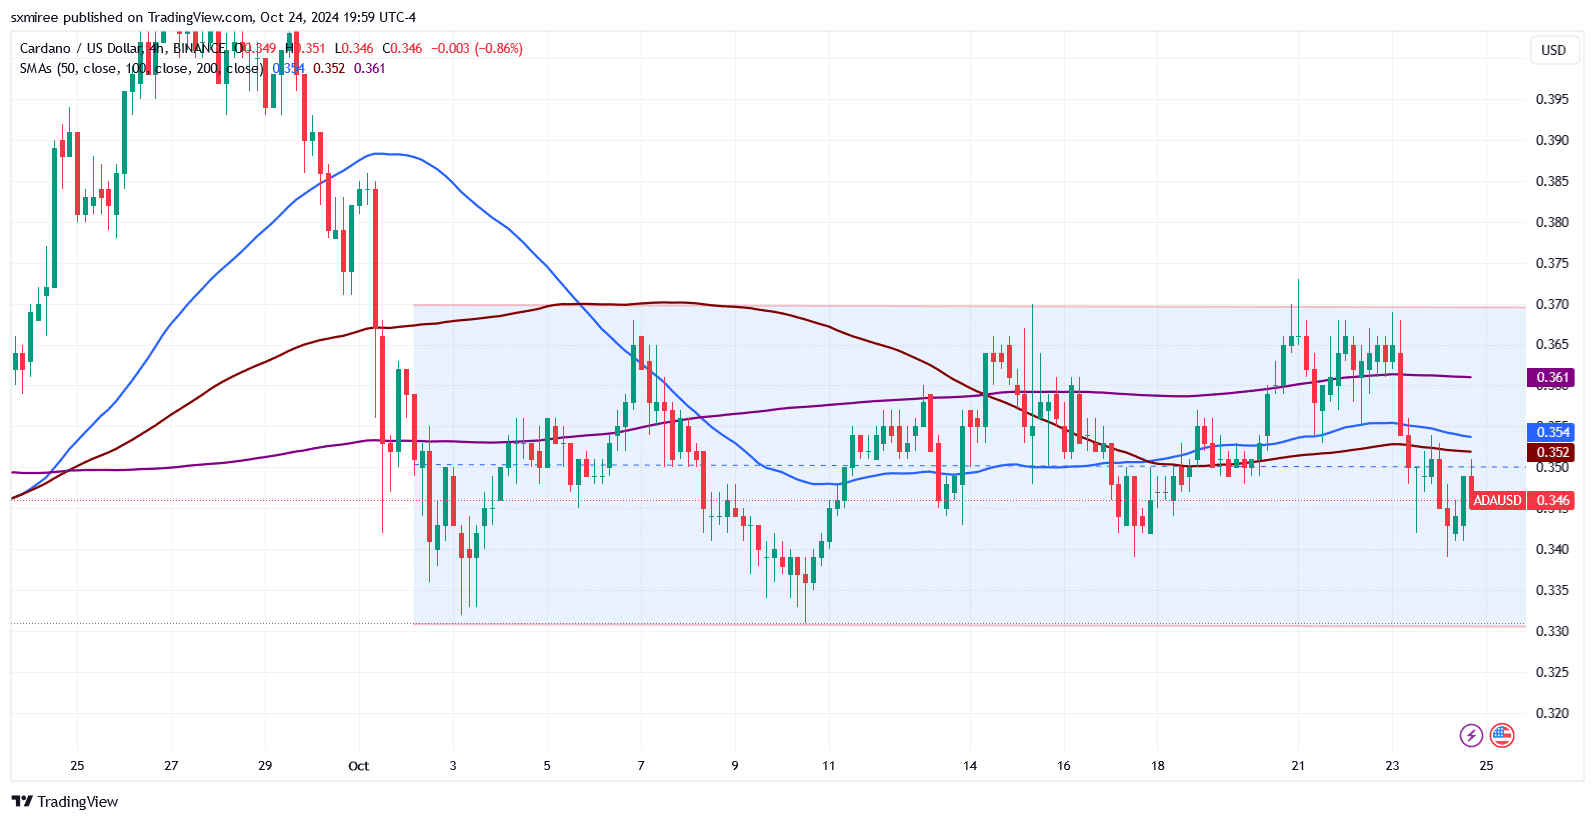
On TradingView’s 4-hour chart, ADA slipped below its short-term moving averages on 23 October after failing to sustain a breakout above the channel ceiling near $0.37.


Source: TradingView
ADA’s recovery attempt on Thursday was met with selling pressure, in stark contrast to the majority of altcoins, which advanced swiftly alongside Bitcoin.
The zoomed-out 4-hr chart revealed that the 50-day and 100-day moving averages were flat, indicating low volatility and market indecision at the altcoin’s press time range.


Source: TradingView
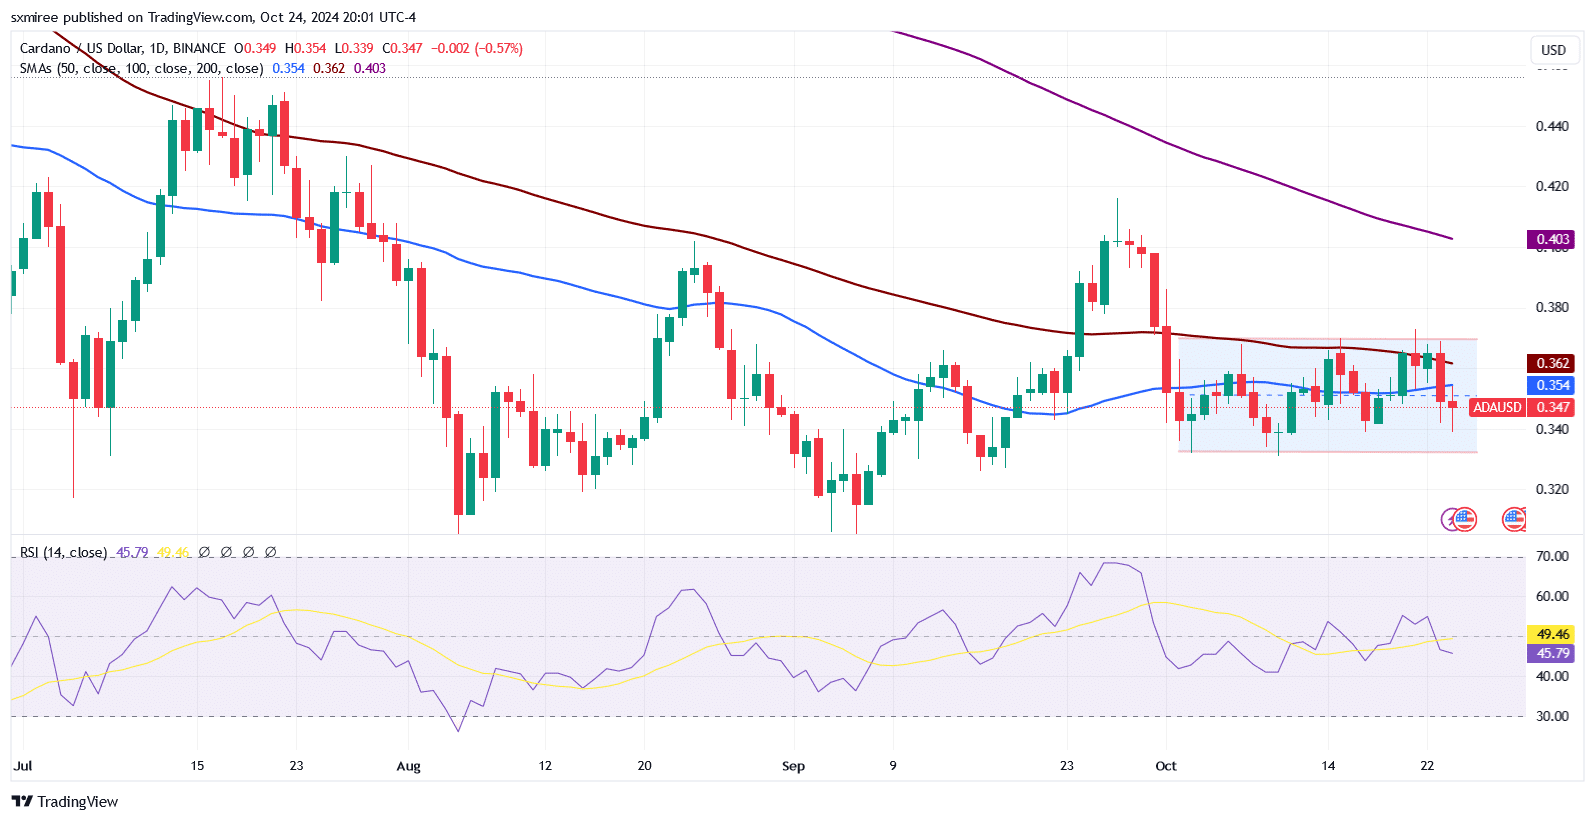
Additionally, the daily RSI reading, which has hovered close to the midpoint thus far in October, confirmed this lack of a strong upward or downward trend to lure market participants.
Onchain activity post-Chang phase 1
Onchain data from CExplorer revealed that the number of active accounts and total transactions has declined since the Chang hard fork’s activation on 2 September.


Source: CExplorer
While the slowdown in on-chain activity has been contrary to general expectations that technical milestones typically lead to greater participation, it simultaneously reflects broader market trends too.


Source: CExplorer
The crypto market’s growth has been contained for the better part of the year, making new entrants hesitant to engage. This, despite new developments within the altcoin’s ecosystem.
ADA/USDT technical analysis
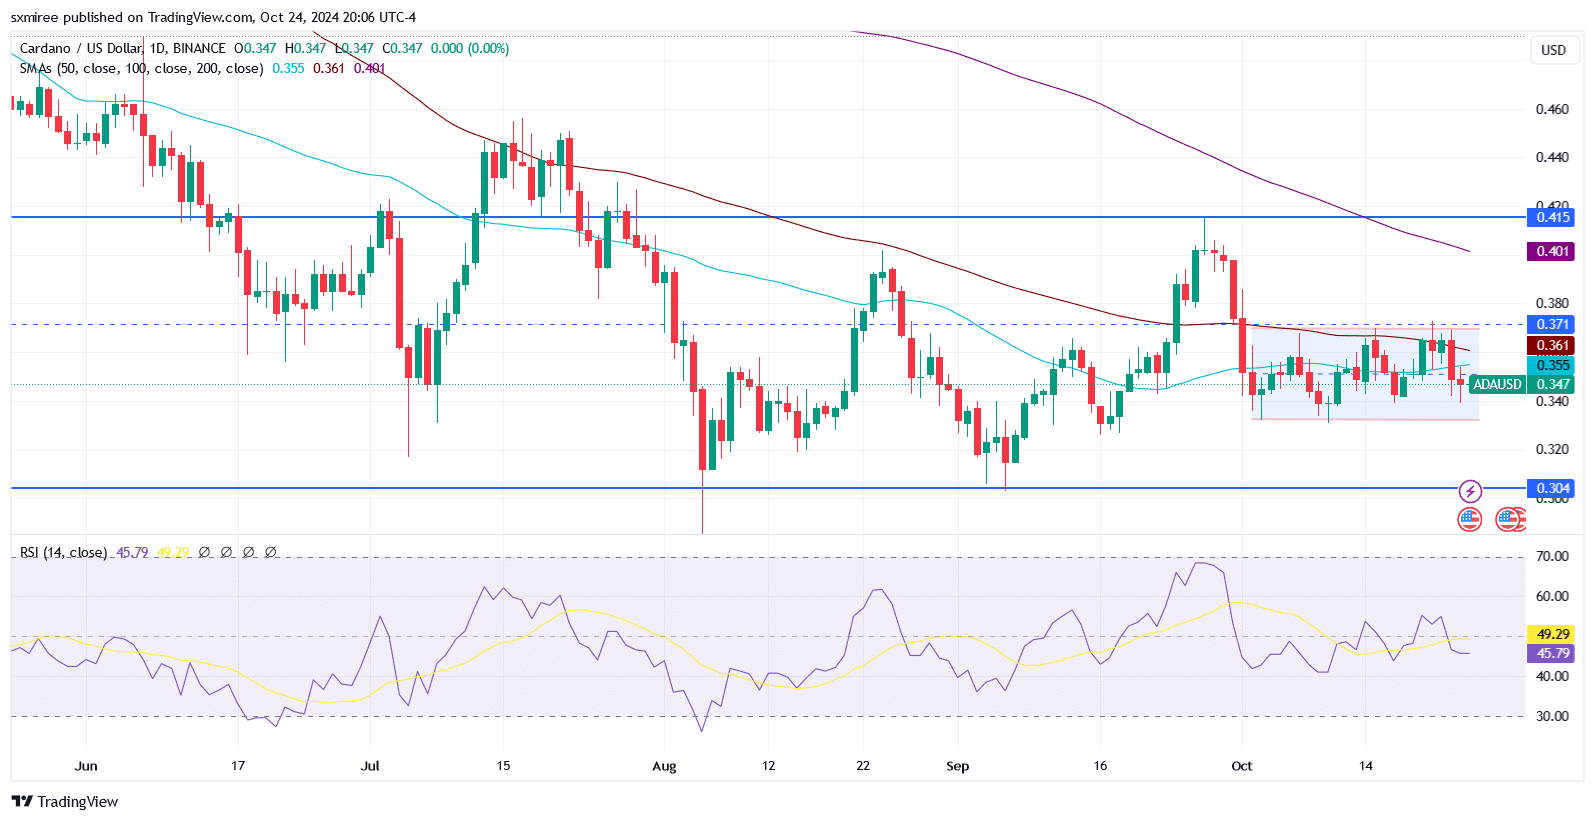
Cardano’s native token, ADA, has been trading within a tight range between $0.33 and $0.36 since the start of the month. Though ADA’s price remains trapped in this narrow range, the implications of its latest higher high since mid-July cannot be ignored.


Source: TradingView
At the time of writing, bulls were eyeing a break above the $0.37 resistance level. This could pave the way for further bullish momentum and bring into view the $0.41 price level.
A drop below the lower bound will activate the crucial support at $0.31, which was tested on 6 September.
Source: https://ambcrypto.com/assessing-if-cardanos-0-37-price-wall-will-hold-up-under-pressure/