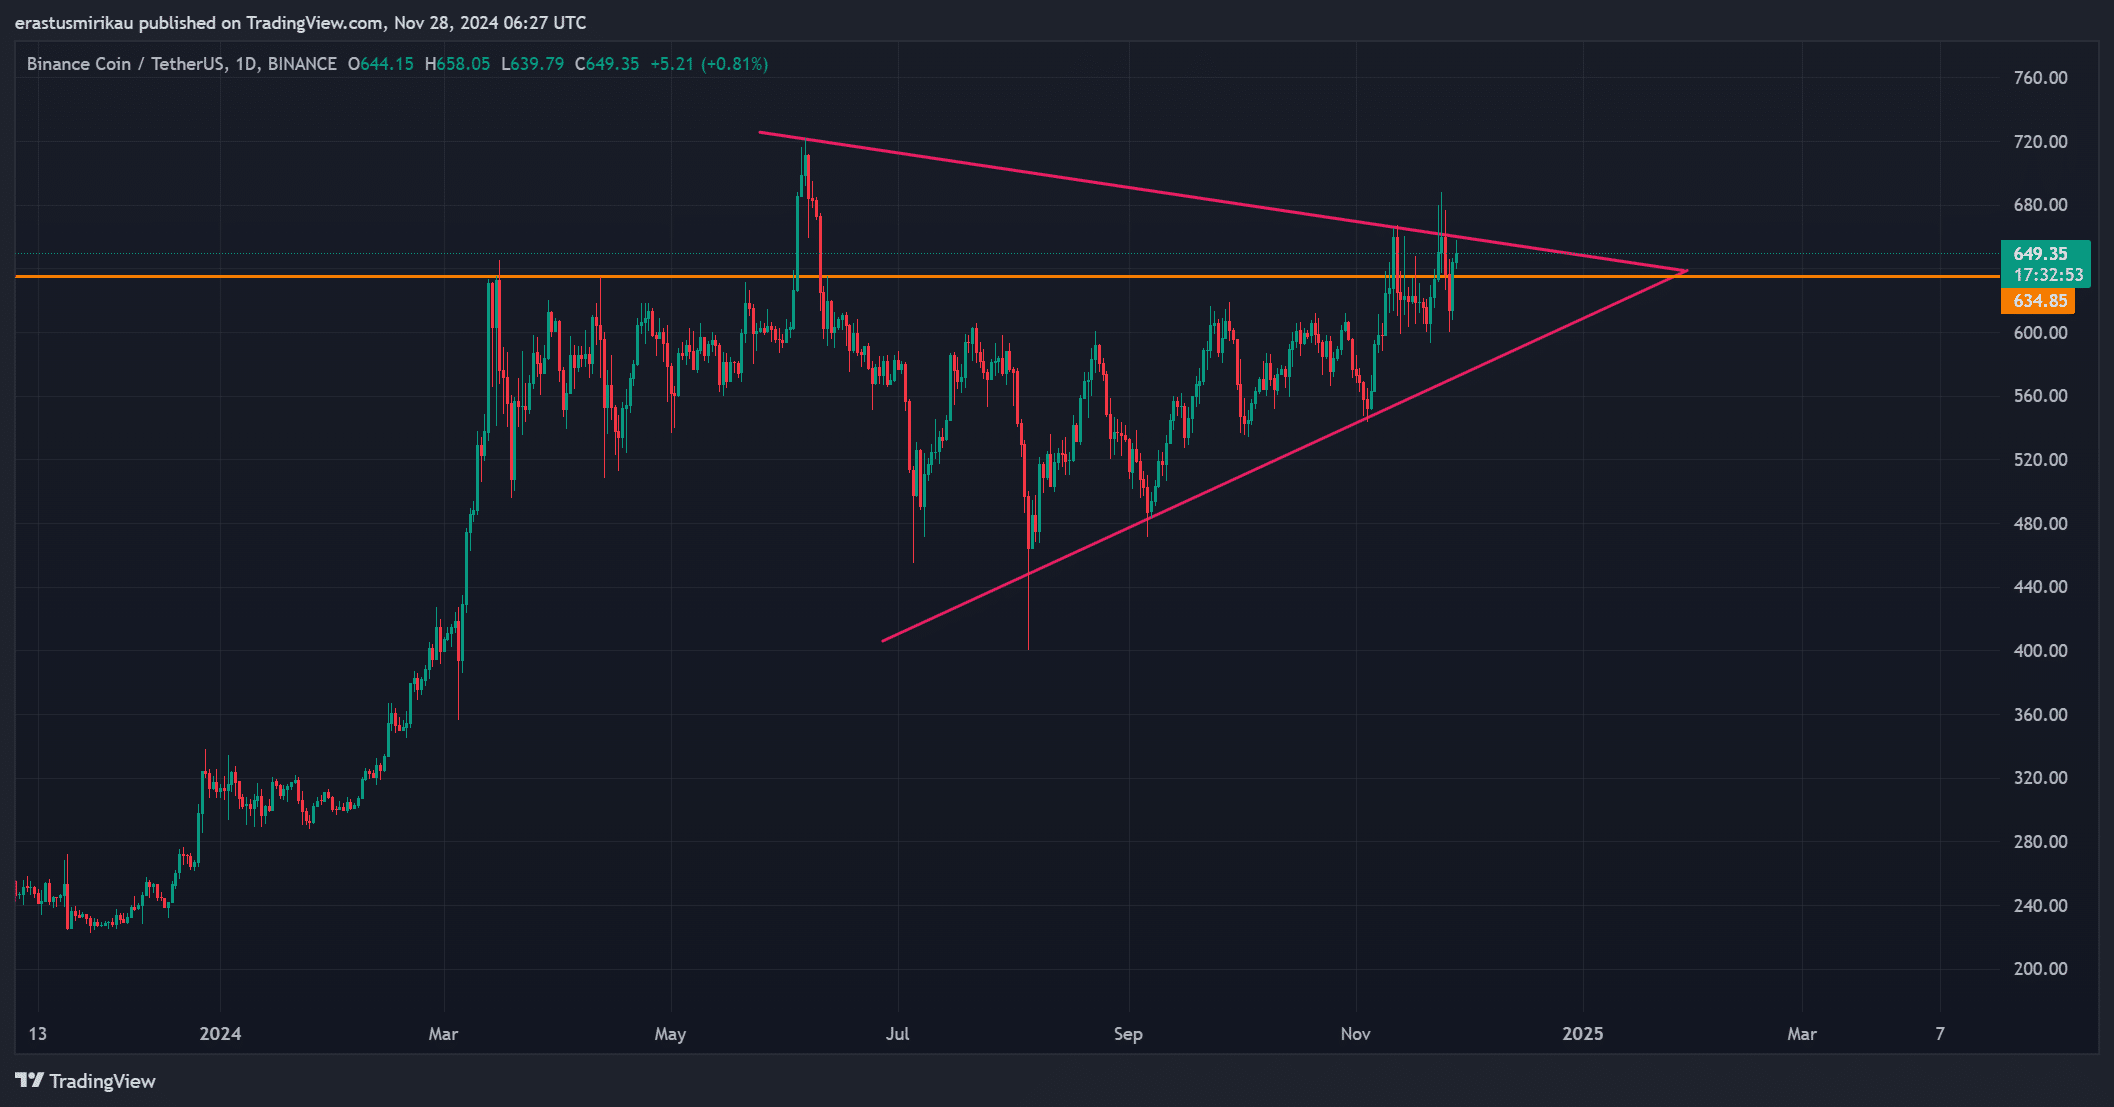
- BNB has broken through the key resistance at $634.85, signaling potential for further bullish movement.
- Technical indicators, rising open interest, and increased social volume suggest sustained momentum in the near term.
Binance Coin [BNB] has made a notable move, breaking through its key resistance level at $634.85, signaling the potential start of a new bullish trend.
As of press time, BNB is trading at $653.79, up 5.79% in the past 24 hours. This breakout has grabbed traders’ attention, leaving many to wonder if the token can sustain its upward trajectory and push toward higher targets.
With key technical indicators flashing bullish signals, all eyes are now on BNB’s ability to hold above this crucial level.
Price action analysis: Is the breakout sustainable?
BNB’s recent price action reveals a decisive breakout from its symmetrical triangle pattern, which had kept the token’s price range-bound for several weeks.
A symmetrical triangle typically signals consolidation before a breakout, and BNB’s price has surged above the key resistance of $634.85.
This level now flips to support, which is crucial for BNB’s ability to continue moving higher. The immediate question is whether BNB can maintain this upward momentum and push toward its next resistance zones around $680 and $700, or if the price will face a retracement.


Source: TradingView
BNB technical indicators: What are the charts showing?
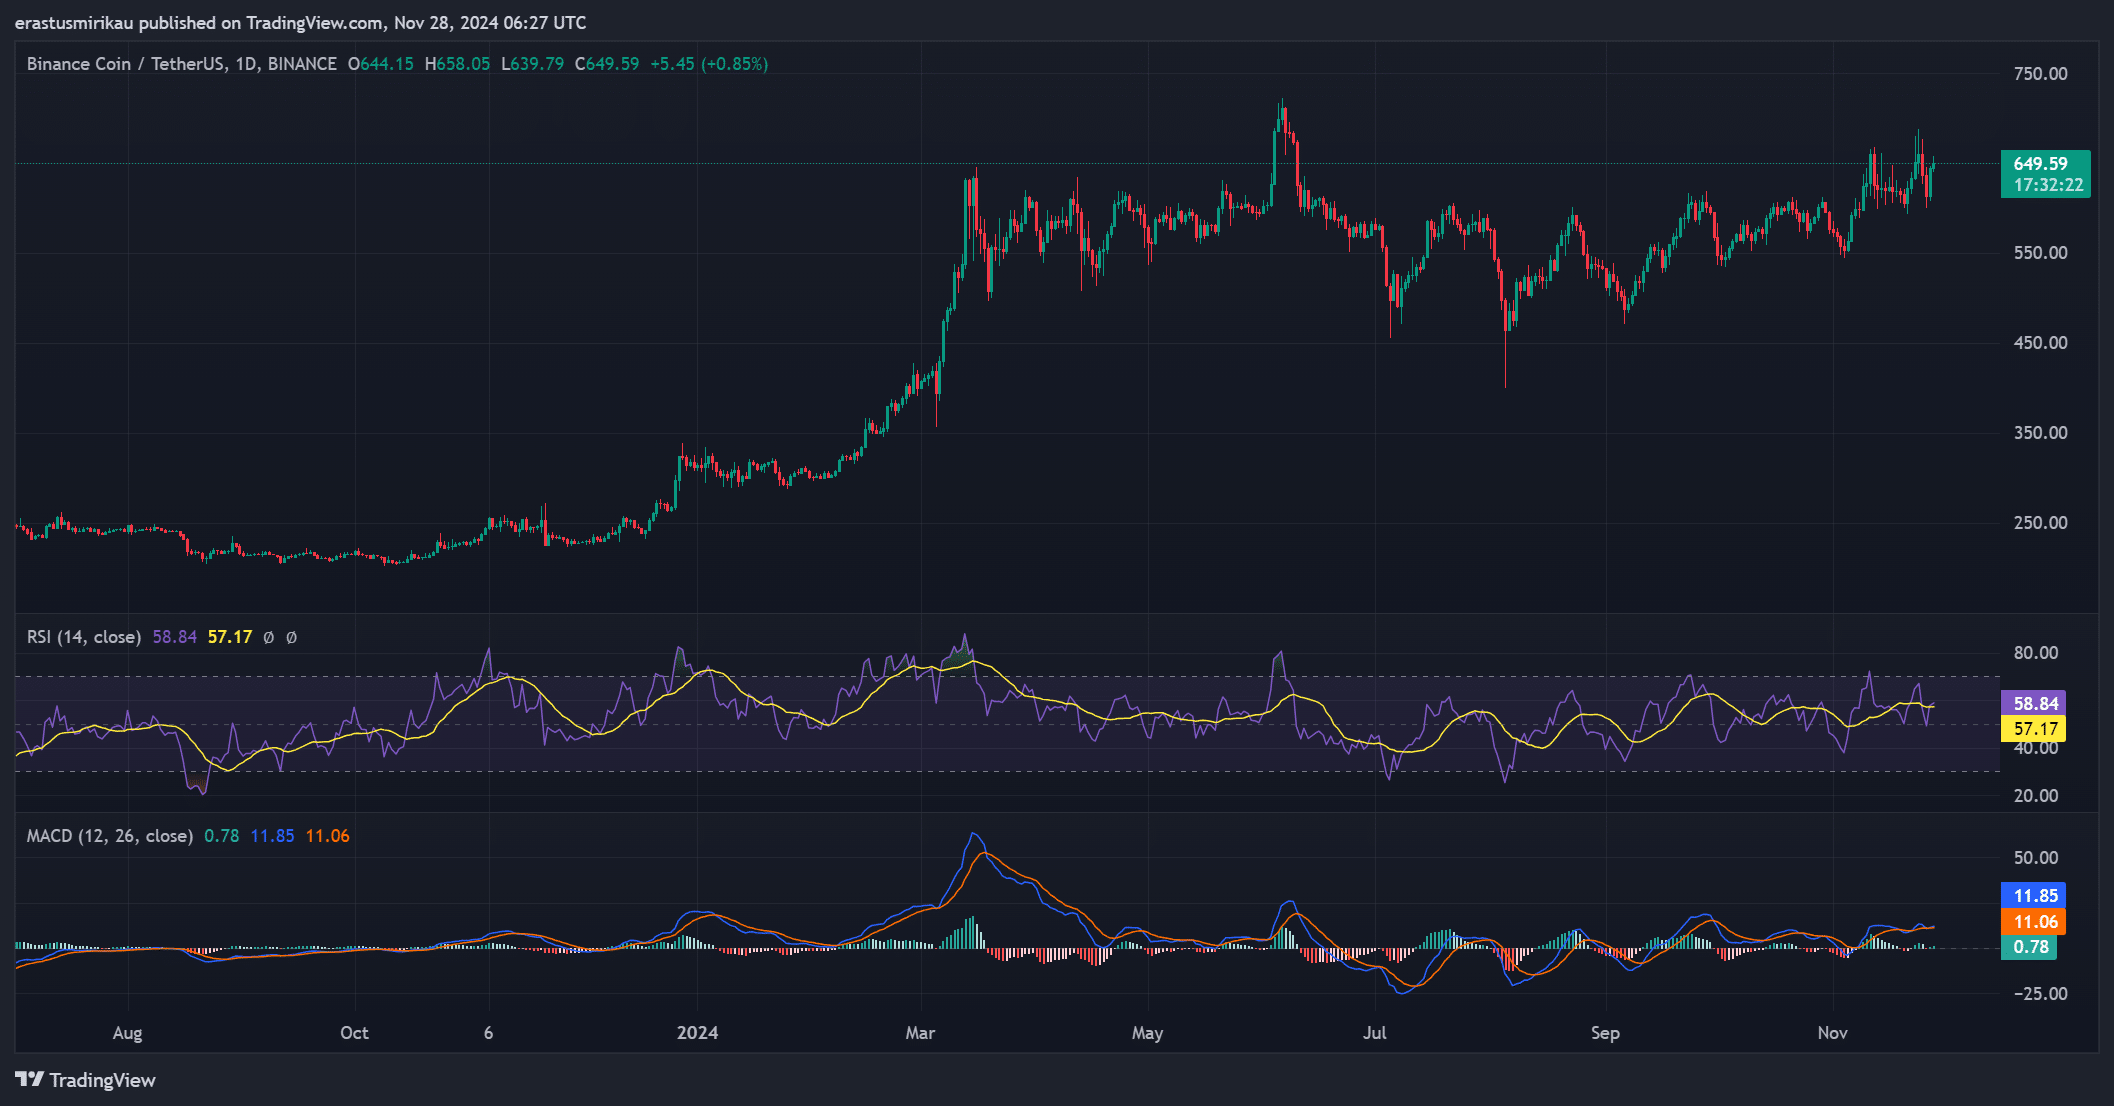
BNB’s Relative Strength Index (RSI) sits at 58.84, indicating that the asset is slightly in bullish territory but not yet overbought. This suggests that there’s still room for further upside before hitting overbought conditions, which could lead to a price pullback.
Additionally, the MACD shows a bullish crossover, reinforcing the possibility of continued upward movement. These indicators suggest that BNB is in a favorable position for further gains, as long as it can maintain support above the breakout level.


Source: TradingView
Social volume: Is there growing interest?
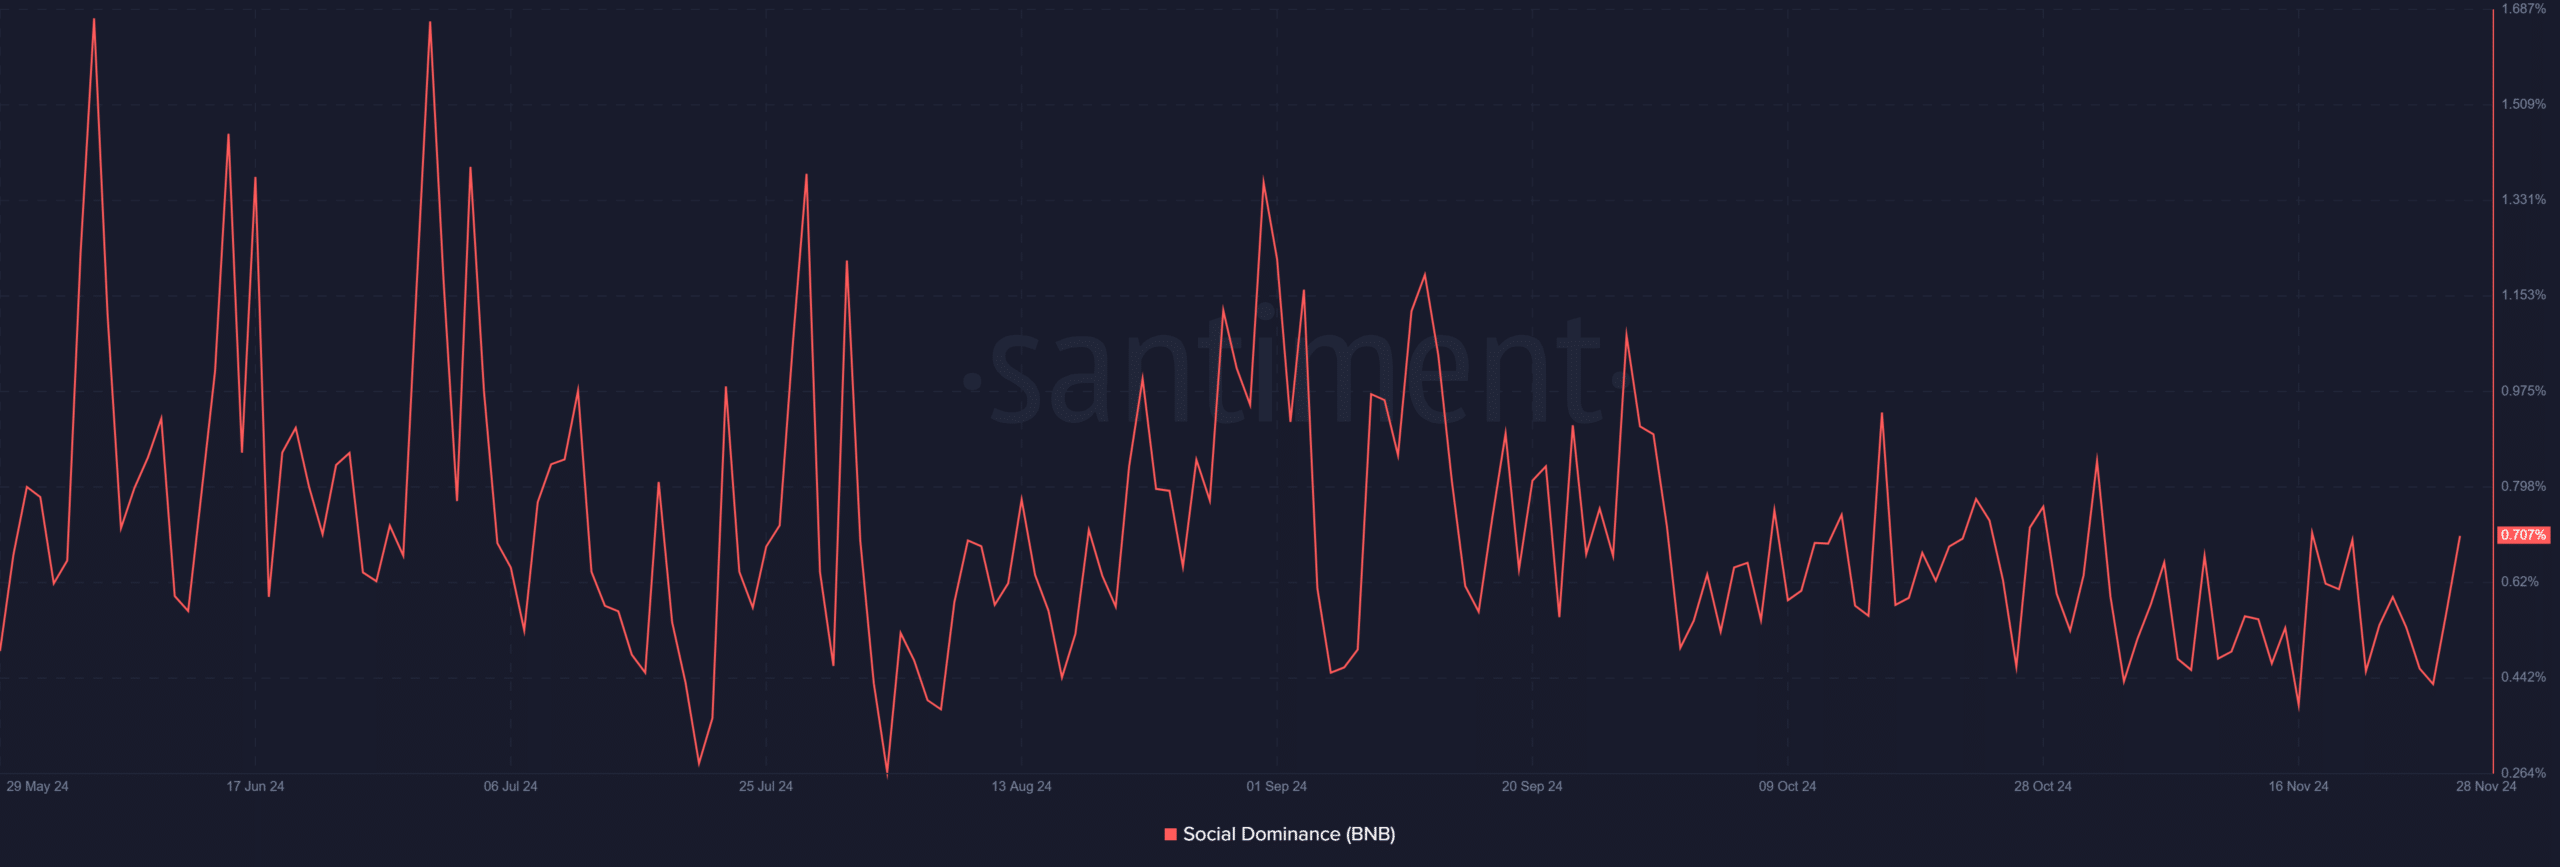
The social volume has experienced a slight increase from 0.565 to 0.707 in the past 24 hours. Although this uptick is modest, it reflects a growing level of interest and engagement around the token.
This rise in social activity often accompanies price rallies, suggesting that more traders and investors are starting to take notice of BNB’s recent price action. If this trend continues, it could help fuel further upward movement in the short term.


Source: Santiment
Market sentiment: What does open interest tell us?
The open interest has risen significantly by +6.74%, reaching $973.10 million. This increase indicates that more traders are opening positions in anticipation of continued price action, reflecting growing confidence in BNB’s bullish prospects.
The rise in open interest suggests that traders expect more price movement and are positioning themselves for potential gains.
Consequently, this positive market sentiment reinforces the idea that BNB has the potential for further upward momentum, as long as it holds above its recent breakout level.


Source: Coinglass
Read Binance Coin’s [BNB] Price Prediction 2024–2025
Conclusion: Is BNB set for further gains?
BNB’s breakout above $634.85, combined with bullish technical indicators and rising open interest, suggests that the token is poised for further gains. The increase in social volume also signals that market interest is growing, potentially fueling more upward movement.
Therefore, BNB seems likely to maintain its bullish trend in the near term. However, traders should remain cautious and watch for any signs of resistance or pullbacks as the price approaches key levels.
Source: https://ambcrypto.com/analyzing-bnbs-potential-after-flipping-this-crucial-price-level/