- Ethereum trades near $3,805, testing its bull market support band around $3,700 after breaking below $4,000.
- Senate’s DeFi proposal sparks fears for Ethereum protocols, adding to pressure from sustained exchange outflows.
- Stablecoin inflows above $3B highlight Ethereum’s structural dominance despite short-term bearish momentum.
Ethereum (CRYPTO: ETH) price today trades near $3,805, struggling to recover after losing key support from its rising channel structure. The sharp rejection near $4,800 triggered heavy selling, driving ETH below its 20-day and 50-day exponential moving averages (EMAs) and straight into the $3,700–$3,750 support zone. This area now aligns with Ethereum’s bull market support band, making it the critical line buyers must defend.
Ethereum Price Tests Bull Market Support


The daily chart shows ETH breaking out of its ascending channel and testing the lower boundary of a long-term symmetrical triangle. The breakdown has pushed the price beneath the 100-day EMA ($3,968) and closer to the weekly bull support band between $3,573 and $3,725.
Momentum indicators suggest continued pressure. The RSI has slipped below the neutral 50 mark, indicating weakening buying strength, while the MACD histogram remains deeply negative. Unless Ethereum can reclaim the $4,000 level soon, a deeper retracement toward $3,523 cannot be ruled out.
DeFi Policy Threat Casts Shadow On Ethereum
The Senate’s new decentralized finance proposal has rattled sentiment across Ethereum-linked markets. While the bill does not explicitly mention Ethereum, its broad scope places the network at the heart of potential regulatory impact.
Under the proposal, any entity offering front-end access to DeFi protocols would need to register as a broker with the SEC or CFTC. This could include developers or organizations operating popular Ethereum-based applications such as Uniswap and Aave.
Market analysts warn that such a rule could drive developers offshore and curb U.S. access to decentralized applications, potentially slowing Ethereum’s transaction activity and liquidity in the short term.
On-Chain Data Shows Persistent Outflows
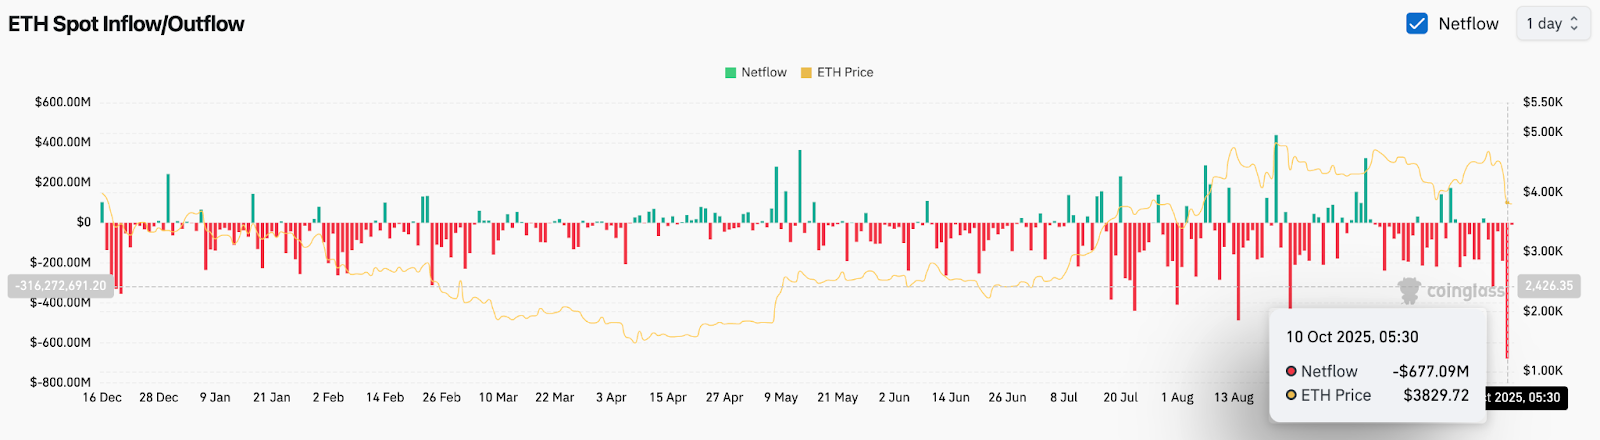

Exchange data from Coinglass highlights significant outflows from Ethereum. On October 10, net outflows reached $677 million, one of the largest single-day capital exits in months. The following day started with another $9 million outflow, reflecting persistent caution among traders.
The sustained red bars across recent sessions indicate that investors are pulling funds off exchanges, possibly opting for self-custody or sidelining capital amid regulatory uncertainty. This trend has historically coincided with volatility spikes and short-term price weakness.
Stablecoin Inflows Offer Partial Cushion
Despite the selling pressure, Ethereum continues to lead the broader crypto ecosystem as the primary settlement layer for stablecoins. Data shared by Coin Bureau on X shows that over $3 billion in stablecoins flowed into Ethereum over the last seven days — more than all other major chains combined.
This inflow underlines Ethereum’s structural dominance in DeFi and payments. Analysts note that stablecoin growth often precedes renewed activity in decentralized exchanges and lending markets, suggesting that once policy clarity emerges, liquidity could return swiftly to the network.
Technical Outlook For Ethereum Price
Ethereum’s immediate resistance stands near $3,968 (100-day EMA) and $4,259 (50-day EMA). A decisive close above these levels would signal a short-term recovery, potentially targeting the $4,420 and $4,600 zones. On the downside, the $3,725–$3,573 support band forms the final buffer before the 200-day EMA at $3,523.
Failure to hold this region could open the door to a test of $3,400, where historical demand from mid-July remains unfilled.
| Ethereum Technical Forecast | Levels |
| Resistance levels | $3,968, $4,259, $4,600 |
| Support levels | $3,725, $3,573, $3,523 |
| Key EMA cluster | 20 EMA $4,290 – 50 EMA $4,259 |
| Momentum bias | Bearish below $4,000 |
| Structure | Breakdown from rising channel into bull support zone |
Outlook: Will Ethereum Go Up?
Ethereum remains under pressure as it trades near the lower boundary of its long-term support structure. The mix of heavy outflows, technical breakdown, and U.S. DeFi policy uncertainty has curbed bullish momentum.
However, the surge in stablecoin deposits signals that the network’s utility and capital base remain intact. Analysts believe that if ETH holds the $3,700 region and reclaims $4,000 in the coming sessions, the broader uptrend could resume.
For now, Ethereum’s next move hinges on whether buyers can defend the bull market band before sellers force a deeper slide toward $3,500.
Disclaimer: The information presented in this article is for informational and educational purposes only. The article does not constitute financial advice or advice of any kind. Coin Edition is not responsible for any losses incurred as a result of the utilization of content, products, or services mentioned. Readers are advised to exercise caution before taking any action related to the company.