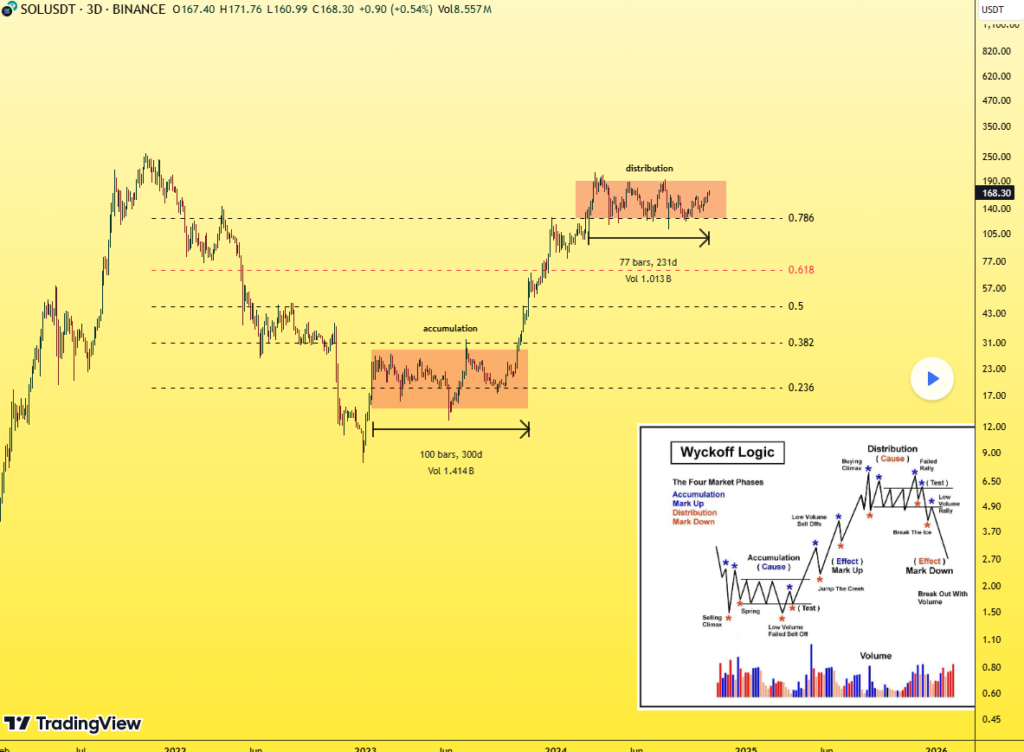
- SOL gains 13% in a week, reaching $174 amid stable trading.
- Analyst identifies potential Wyckoff distribution pattern on weekly chart.
- $125 support breach could signal broader market exit, possible within two months.
Solana’s recent market performance has sparked both optimism and caution among analysts, with a notable warning emerging about potential bearish signals. Despite a strong 13% weekly gain pushing the price to $174, technical analysis suggests the possibility of a significant market shift.
TradingView analyst Ceciliones has identified Solana as a crucial market indicator, citing its impressive history of serving as a leading signal for broader crypto market movements. SOL’s previous 600% surge following a 300-day accumulation phase demonstrates its potential influence on market sentiment.


Can Solana plunge to $125 support?
The weekly chart analysis reveals what appears to be a Wyckoff distribution pattern, a technical formation often preceding significant price declines.
The 0.786 Fibonacci retracement level at $125 emerges as a critical support point, with its potential breach serving as a possible trigger for market-wide selling pressure.
Technical indicators offer mixed signals about SOL’s immediate future. The Relative Strength Index (RSI) reading of 67.72 approaches but remains below the overbought threshold of 70, suggesting strong but potentially cooling buying momentum.
Meanwhile, the Moving Average Convergence Divergence (MACD) maintains a bullish stance, though the converging signal lines hint at stabilizing momentum.
Recent whale activity adds another layer to Solana’s market dynamics. A significant movement of 32,695 SOL from Binance into various meme coins suggests shifting investment strategies among large holders.
Furthermore, Pump.fun’s sale of 40,000 SOL tokens and substantial fee accumulation indicates active profit-taking within the ecosystem.
Source: https://thenewscrypto.com/solana-at-crossroads-analyst-warns-of-125-critical-support/