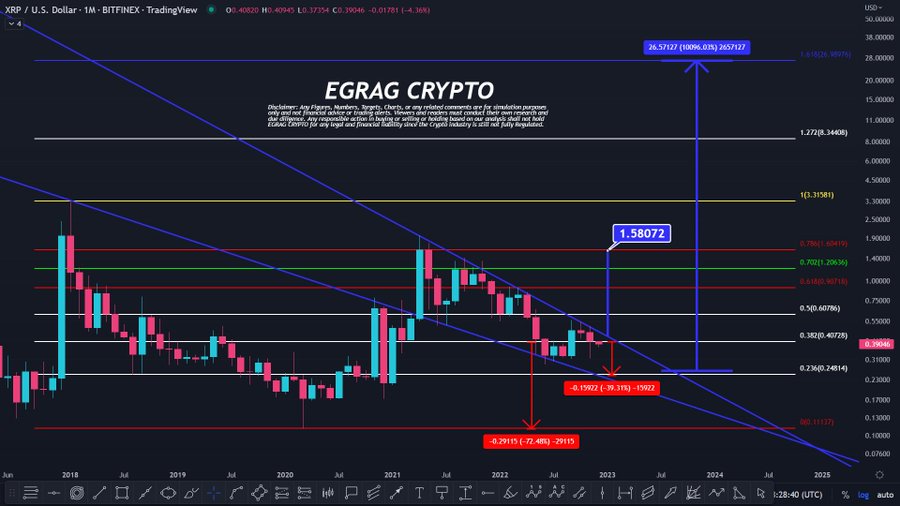
Crypto market analyst EGRAG suggested in an analysis that from its position, XRP could surge 10,000% or crash by as much as 72%.
He presented this analysis at a time when XRP, like in the current market state, sat at a pivotal level. Notably, it has the potential to either skyrocket or crash from this level. On the bearish side, EGRAG revealed the possibility of XRP falling by 40% to 72%.
This decline would come after breaking key support levels, particularly the Fibonacci retracement levels visible on the chart. The price could drop to as low as $0.15922 (a 39.31% drop) or even $0.11137 (a massive 72.48% crash).
These figures are based on previous key support areas and downward trend lines that have governed XRP’s price action since the 2018 peak.
The downward movement in EGRAG’s chart also highlights the multiple failed breakout attempts over the years. XRP has struggled to surpass significant resistance levels, hovering between the $0.50 and $0.90 range, only to be rejected time and time again.

This lack of bullish momentum is one of the reasons why EGRAG foresees a potential bearish outcome, as XRP continues to linger in a descending channel.
The 10,000% Upside Potential
Despite the potential for further losses, EGRAG emphasizes the incredible upside XRP could achieve. The chart suggests a potential breakout from the long-term downward trend that XRP has been locked in since its all-time high in 2018.
If this breakout happens, it could lead to an explosive rally of over 10,000%, catapulting XRP’s price to the $26 mark. The Fibonacci extensions visible on the chart show potential price targets of $8.34 (1.272 extension) and $26.57 (1.618 extension).
If XRP breaks through its immediate resistance levels and moves past $1.58, the sky is the limit. EGRAG’s analysis shows that XRP is approaching a critical juncture. While the coin remains within its descending channel, there is the potential for a massive reversal if buyers step in at key levels.
Historically, XRP has experienced sharp, parabolic moves, and EGRAG suggests that history could repeat itself if the right conditions align.
XRP Support and Resistance Levels
The chart provides key levels that traders and investors should keep an eye on. For XRP to avoid further declines, it must hold above the $0.236 Fibonacci retracement level, which is around $0.248.
If it falls below this, the next major support levels are at $0.159 and $0.111, both of which would represent significant bearish moves.
On the other hand, a move above $1.58 would signal a potential breakout from the descending trendline. Once XRP clears this level, the next major resistance level is at $3.31, followed by the Fibonacci extensions that indicate targets of $8.34 and $26.57.
Disclaimer: This content is informational and should not be considered financial advice. The views expressed in this article may include the author’s personal opinions and do not reflect The Crypto Basic’s opinion. Readers are encouraged to do thorough research before making any investment decisions. The Crypto Basic is not responsible for any financial losses.
Source: https://thecryptobasic.com/2024/09/26/analyst-sees-xrp-soaring-10000-heres-why/?utm_source=rss&utm_medium=rss&utm_campaign=analyst-sees-xrp-soaring-10000-heres-why