Two prominent analysts identify an XRP golden cross on different timeframe, with projections of a possible 10x to 650x price spike.
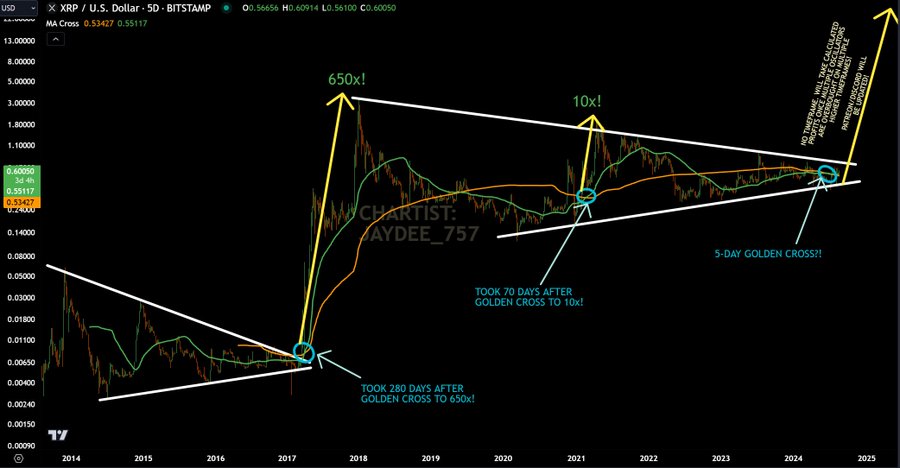
These projections hinge on XRP’s historical performance following previous formations of this pattern. Taking to X, market analyst Jaydee shared a 5-day chart where XRP has formed a golden cross, as its short-term moving average finally crosses above a long-term moving average.
Larger Golden Cross
Notably, Jaydee highlighted two previous golden crosses, which led to dramatic price increases. The first, occurring in 2017, saw XRP surge 650 times its initial value within 280 days. This led to the massive historic run that resulted in the $3.31 all-time high.
The second cross occurred in 2021, a few months after the U.S. SEC sued Ripple for allegedly securities laws violations. Despite XRP’s downward spiral following the lawsuit, the golden cross triggered an impressive run. XRP eventually spiked 10x within 70 days to hit a high of $1.96 in April 2021.

According to Jaydee, the latest golden cross on the 5-day chart could be signaling a similar bullish breakout. The chart indicates that XRP has been trading within a symmetrical triangle pattern. Multiple analysts have identified this pattern on different timeframes.
Notably, the convergence of the moving averages at the apex of this triangle suggests a potential explosive breakout to the upside, potentially leading to the kind of gains seen in previous cycles.
Consequently, Jaydee expects XRP to rally by 10x to 650x once the uptrend begins. From its current trading price around $0.60, a 10x increase would put XRP at a more realistic price of $6. However, a 650x spike could push prices toward $390.
XRP Forms Smaller Golden Cross
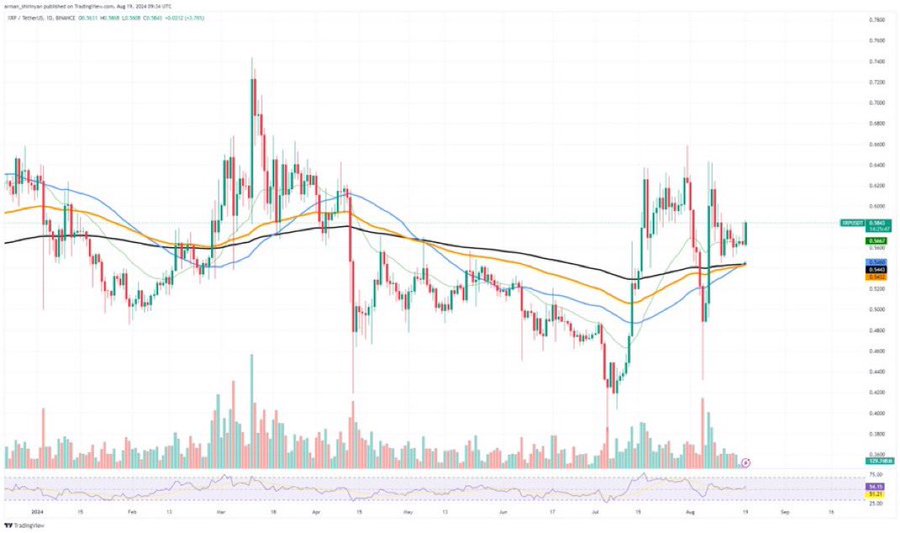
Interestingly, another analyst Xoom called attention to the daily timeframe, where another golden cross has formed. While this cross is on a smaller scale, its significance for the short-term remains crucial.

The last time XRP formed this sort of golden cross on the daily chart was in early February of this year. Following that signal, XRP’s price surged by 50%, from $0.4968 on Feb. 5 to $0.7449 by March 11. Data shows XRP trading just above the golden cross, consolidating within a tight range.
XRP on a Rebound Path
Meanwhile, after weeks of a downtrend, XRP appears to be on a recovery path. XRP currently trades for at $0.6089, having bounced off support around $0.44921, as indicated by the S1 pivot point.
Notably the Pivot Points clearly define the resistance levels, with R1 at $0.65974, R2 at $0.72478, and R3 at $0.83004. Should XRP break through these resistance levels, it could pave the way for the significant price increases suggested by the golden cross.


The MACD indicator is also in bullish territories. The MACD line has crossed above the signal line, representing a buy signal. Additionally, the histogram has shifted into positive territory, further indicating that momentum is turning in favor of the bulls.
Disclaimer: This content is informational and should not be considered financial advice. The views expressed in this article may include the author’s personal opinions and do not reflect The Crypto Basic’s opinion. Readers are encouraged to do thorough research before making any investment decisions. The Crypto Basic is not responsible for any financial losses.
Source: https://thecryptobasic.com/2024/08/20/xrp-golden-cross-finally-confirmed-analyst-sees-possible-10x-to-650x-spike/?utm_source=rss&utm_medium=rss&utm_campaign=xrp-golden-cross-finally-confirmed-analyst-sees-possible-10x-to-650x-spike