XRP continues to defend the pivotal support at Fibonacci 1.618 despite the market uncertainty, with the ongoing Wave 5 expected to lead to double digits.
Crypto analyst EGRAG discussed this in a recent analysis of XRP’s price movements over a 3-month timeframe. The market watcher stressed the importance of the support level of Fibonacci (Fib) 1.618, which XRP has successfully maintained despite market volatility.
Fibonacci Levels Indicating Strong Support
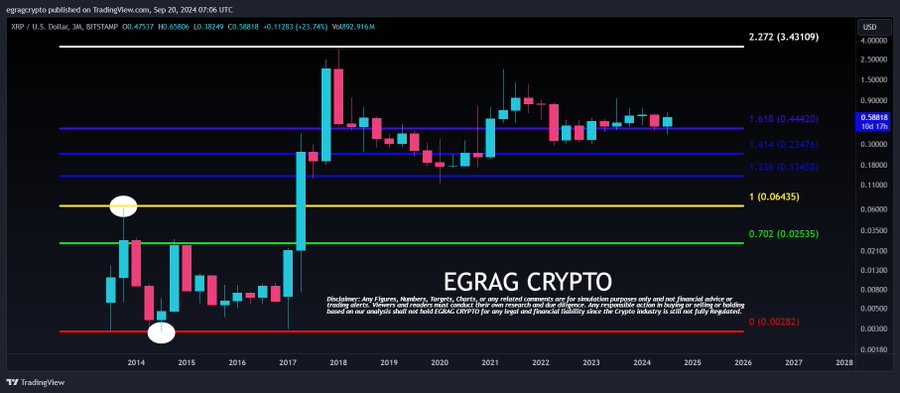
From an accompanying chart, EGRAG showed that the Fibonacci 1.618 support aligns with the $0.4442 price level which is crucial for XRP’s support. The last time XRP retested this level was during the broader market collapse in July. Following the retest, XRP recovered sharply.

However, EGRAG stressed that if XRP fails to maintain this level on the monthly timeframe, the consequences could be detrimental, likely leading to a dramatic price drop. However, the current price action shows that XRP is comfortably holding this level, hinting at potential gains.
Besides the 1.618 support, EGRAG’s chart also highlights additional Fibonacci levels like Fib 1.414 at $0.2347 and Fib 1.236 at $0.1345. Meanwhile, the upward Fibonacci target on the chart, at Fib 2.272 ($3.4), aligns with XRP’s all-time high from January 2018.
XRP Elliott Wave
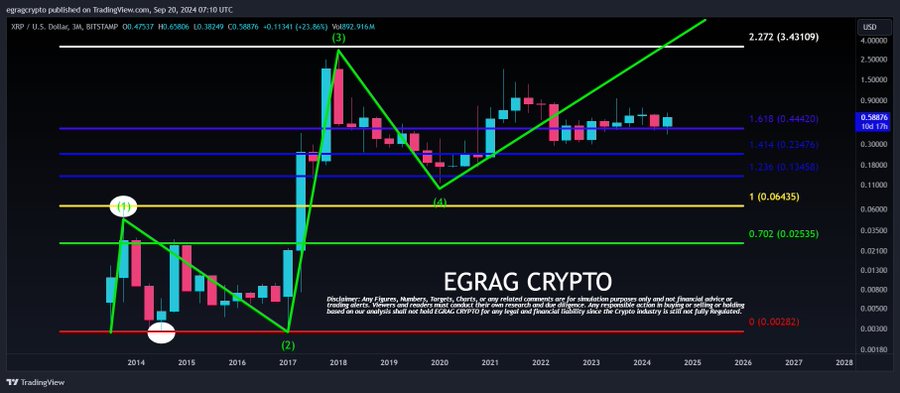
Beyond Fibonacci levels, a second chart from EGRAG discusses an Elliott Wave structure, outlining the long-term price movements of XRP. Per the chart, XRP has been completing a series of waves since its inception, with the current positioning indicating the completion of Wave 4 and the early stages of Wave 5.

Looking back, XRP completed the Wave 1 formation when it spiked to a peak of $0.0614 in 2013. However, this surge preceded a sharp decline in XRP’s price, leading to Wave 2. XRP concluded the second wave when it retraced to a bottom price of $0.003 in January 2017.
Meanwhile, Wave 3, the most bullish phase, began when XRP started recovering from the $0.003 floor price. As XRP staged the most impressive comeback in its history, Wave 3 took XRP to its all-time high of $3.4 in January 2018.
However, XRP entered a correction phase after hitting a roadblock at the all-time high. Since then, the crypto asset has been in a consolidation phase, forming a six-year symmetrical triangle. The drop led to the formation of Wave 4, with XRP bottoming out at $0.114 in January 2020.
XRP Could Target $3.4
The Elliott Wave structure now indicates that XRP is currently trading within Wave 5, which historically tends to be a bullish phase, signaling new price highs. Wave 5 began with the rebound from the $0.114 low. EGRAG noted that this wave would push XRP to double-digit targets but was not specific.
However, based on the Fibonacci projection, Wave 5 could take XRP to new all-time highs. The chart’s top target at Fib 2.272 ($3.4) suggests that XRP could challenge its previous peak, with potential to surpass it, considering the market conditions during the final bullish wave.
Disclaimer: This content is informational and should not be considered financial advice. The views expressed in this article may include the author’s personal opinions and do not reflect The Crypto Basic’s opinion. Readers are encouraged to do thorough research before making any investment decisions. The Crypto Basic is not responsible for any financial losses.
Source: https://thecryptobasic.com/2024/09/24/analyst-expects-xrp-macro-wave-5-to-surpass-3-4-as-fib-1-618-support-holds/?utm_source=rss&utm_medium=rss&utm_campaign=analyst-expects-xrp-macro-wave-5-to-surpass-3-4-as-fib-1-618-support-holds