- ADA’s price action mirrored the February cycle, where a $0.52 pullback triggered a breakout to $1.14.
- Is a similar repeat probable with bullish metrics, or does this signal a bull trap in the making?
Cardano [ADA] is exhibiting tight consolidation on the daily chart, a typical precursor to heightened volatility. Its current price action aligns with the mid-February structure, with ADA trading at $0.75, a press time, and encountering resistance at $0.79.
The market structure remains bullish, supported by strength across both spot and futures markets. Given the current momentum, the probability of a retest of the $0.56 support zone appears low.
Moreover, on the 25th of March, ADA registered 1.06 billion in trading volume at $0.74, closely mirroring the mid-to-late February accumulation phase, which preceded a breakout to $1.14.
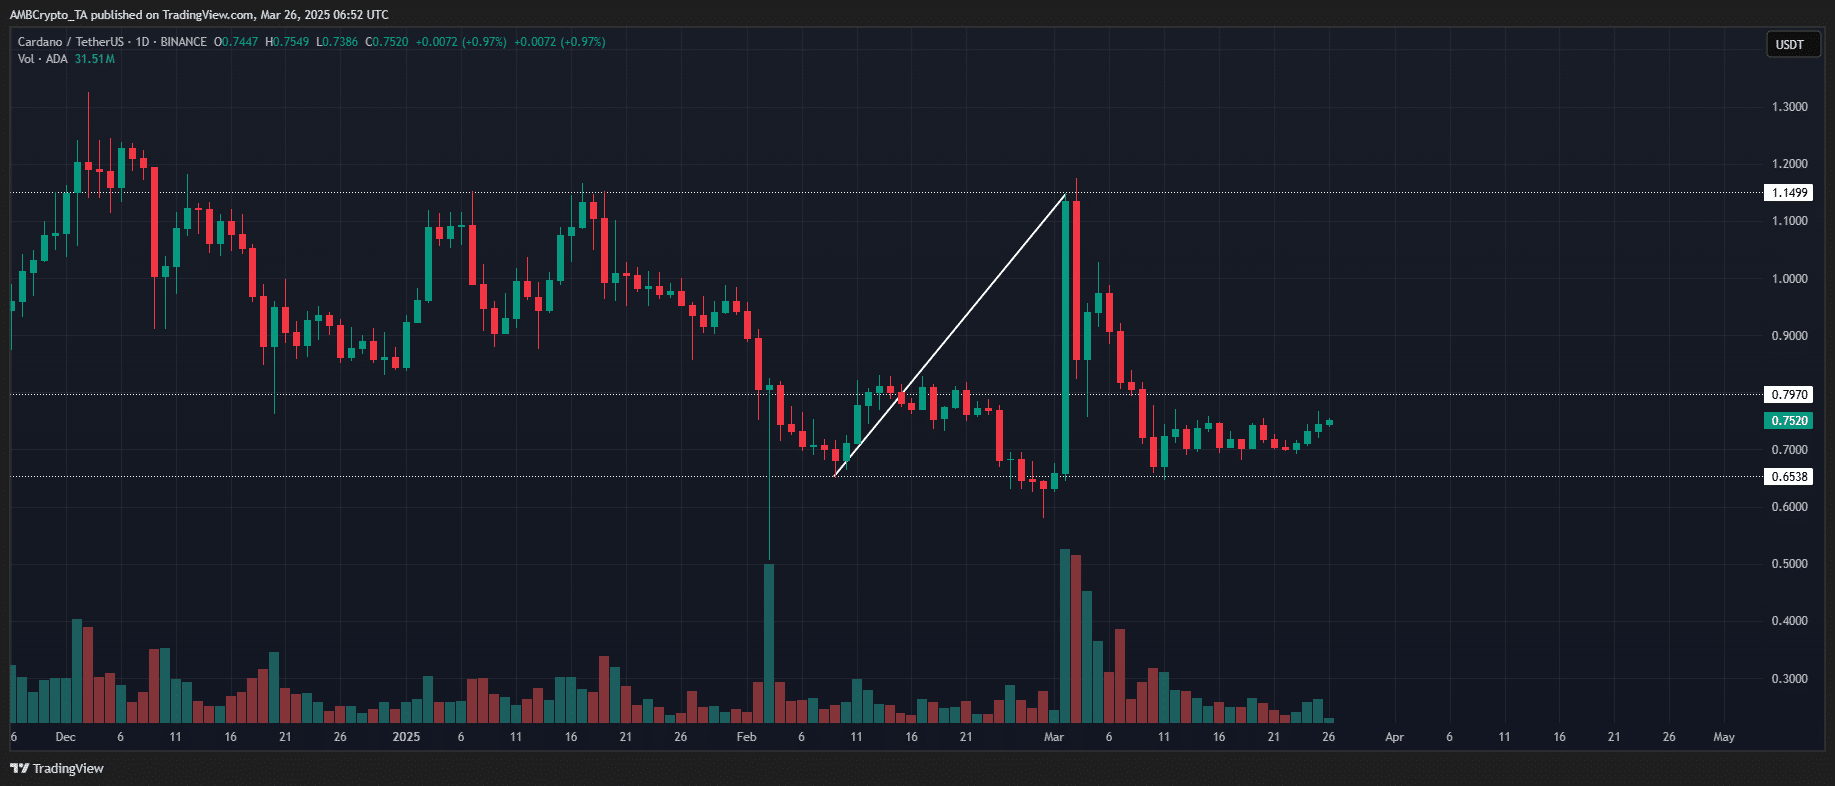

Source: TradingView (ADA/USDT)
If the current pattern persists, ADA may be positioned for another strong upward move. Its recent BingX listing strengthens this outlook by potentially improving liquidity and market depth across a 10-million-user trading platform.
Additionally, capital rotation from Bitcoin to Cardano is noticeable, as the ADA/BTC pair shows a bullish shift. Bitcoin’s steady upward trend is fostering risk-on sentiment, encouraging capital inflows into altcoins.
Considering these factors, a retest of the $0.80 resistance level appears highly likely for Cardano. However, a confirmed breakout remains uncertain. Elevated bull trap risks at key resistance levels could lead to distribution-driven reversals.
Red flags point to a possible ADA bull trap
An analysis of Cardano’s derivatives market reveals a notable uptick in risk appetite among traders. Open Interest (OI) has surged 4.24% to $834 million, reflecting increased leveraged exposure.
Meanwhile, the Funding Rates have turned positive for the second consecutive session, the first such occurrence this month, indicating long-side dominance.
In a bullish liquidity cycle, whale accumulation has intensified, with large Cardano entities absorbing 240 million ADA over the past week, reinforcing network inflows.
This capital injection parallels the late February expansion phase, when OI soared to $1.25 billion, fueling ADA’s breakout.
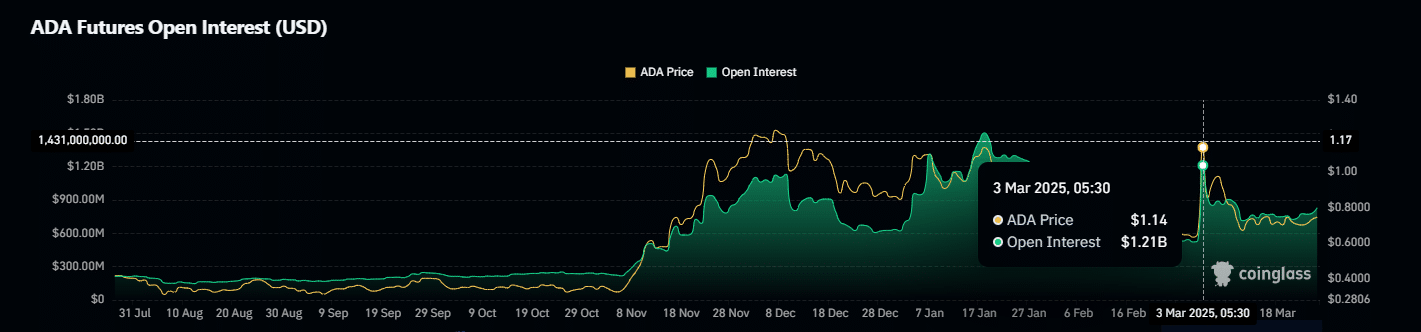

Source: Coinglass
However, unlike the previous cycle, trend validation remains uncertain as macro-driven volatility persists, elevating the risk of a market-wide deleveraging event.
To avoid a bull trap, ADA needs a decisive breakout above key resistance clusters. If it fails to reclaim the $0.80–$0.85 range, overleveraged long positions could face liquidation. This may lead to a distribution phase and trigger cascading sell-offs.
With the current market structure, a retracement toward the $0.65 demand zone is a realistic possibility. However, bulls must turn resistance into a confirmed support level to prevent this outcome.
Source: https://ambcrypto.com/ada-eyes-0-80-next-but-is-this-a-bull-trap-in-the-making/