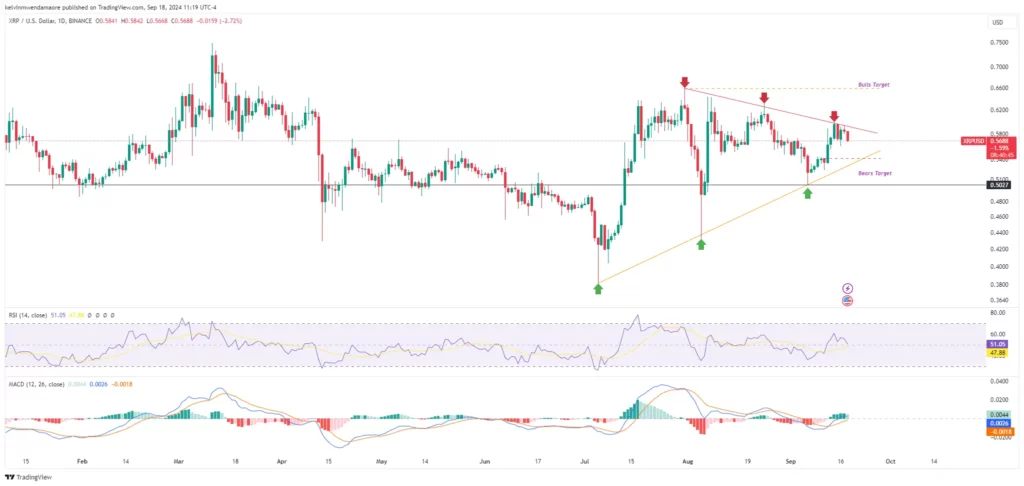
Ripple’s native token, XRP, has formed a symmetrical triangle pattern on its daily chart, typically indicating price consolidation. This pattern, which involves lower highs and higher lows, suggests a potential breakout move in either direction. However, XRP’s price recently dipped after encountering resistance at the triangle’s upper boundary, leading analysts to predict a potential retrace to the $0.54 support level.
XRP Price Action
According to CoinMarketCap data, XRP’s price stands at $0.5663 at the time of writing, reflecting a 4.12% decrease over the past 24 hours. This decline has pushed its market cap to $31.93 billion, although XRP remains the seventh-largest cryptocurrency by market capitalization.


Over the last day, the trading volume has also fallen by 20.27%, currently hovering around $962.86 million. These figures suggest a strong bearish sentiment driven by selling pressure and a lack of bullish momentum in the market.
Further reinforcing the bearish outlook, on-chain data from XRPSCAN reveals a noticeable decrease in transaction activity and the number of active wallet addresses. Per the data, the number of active addresses holding XRP has dropped to 7.537K today from a peak of 15.105K, last seen on September 3. This sharp decline signals that fewer investors are engaging with XRP, adding to the downward pressure on the price.


Is a Retrace to $0.54 Likely?
Given the current technical indicators, market experts anticipate that XRP may retrace to $0.54 before attempting another move. For instance, the Relative Strength Index supports this theory, as it has dropped to 51.05, signalling weakening bullish momentum. Meanwhile, the Moving Average Convergence Divergence indicator shows a narrowing green histogram, which points to reduced buying pressure.


The MACD line is also inching closer to the zero line at 0.0026, suggesting a potential price correction in the short term. If XRP fails to hold the $0.54 support level, the price could dip further to test lower levels, such as $0.52 or even $0.50.
Conversely, if the market sentiment shifts, a breakout above the triangle’s upper boundary around $0.59 could trigger a rally, with XRP potentially reaching the $0.62 resistance level. A strong, bullish move could even see XRP retesting the $0.65 mark before the end of the week.
Also Read: Ripple CLO Reveals How 2024 Elections Will Shape XRP’s Future
Source: https://www.cryptonewsz.com/xrp-price-dips-signal-hints-possible-pullback/