
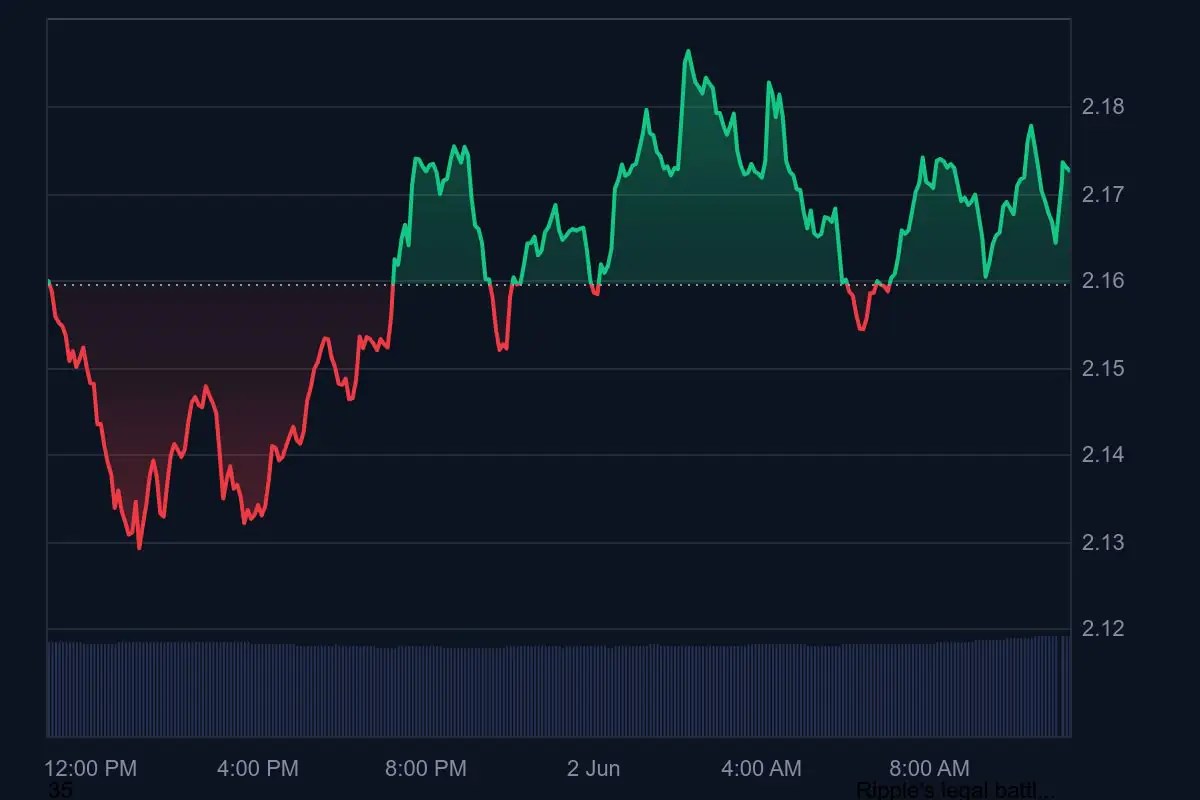
XRP is experiencing modest gains today, trading at $2.17 with a 0.85% increase over the past 24 hours.
At the time of writing the cryptocurrency holds a market capitalization of $127.71 billion, with a daily trading volume of $1.95 billion—up 7.59%.
Despite the uptick, technical signals indicate that XRP may soon face critical inflection points.
While XRP remains in the green, a closer look at the intraday price chart reveals significant fluctuations, with notable resistance just above $2.18 and several sharp pullbacks throughout the past 24 hours.
EGRAG Crypto’s Multi-Timeframe Outlook
Renowned technical analyst EGRAG shared a multi-timeframe breakdown using the 21, 33, 55, and 111 simple moving averages (SMAs). This approach aims to anticipate short- and medium-term movements by analyzing trend behavior across different time horizons.
What to Watch
- 2 Weeks Outlook
XRP could wick down to as low as $1.93, suggesting possible short-term downside risk. - 1 Week Resistance Zones
Key resistance levels are identified at $2.41, $2.55, and $2.73, posing challenges for any bullish continuation. - 5 Days Target
A potential retracement toward $1.88 is being monitored, indicating bearish pressure in the near term. - 3 Days Focus
The $2.10 level is considered a pivotal zone for support or potential reversal. - 1 Day Trend
Price action is currently described as a “spaghetti mess,” signaling short-term uncertainty and entangled technical signals.
Conclusion
XRP’s recent price action reflects both bullish recovery and looming downside risk. As it fluctuates around $2.17, analysts are keeping a close watch on critical resistance zones and potential wicks to the downside. Traders are advised to monitor these SMA-based levels and approach the market with caution amid the mixed technical landscape.

Kosta Gushterov
Reporter at Coindoo
Kosta has been a part of the team since 2021 and has solidified his position with a thirst for knowledge, incredible dedication to his work and a “detective-like” mindset. He not only covers a wide range of trending topics, he also creates reviews, PR articles and educational content. His work has also been referenced by other news outlets.
Source: https://coindoo.com/xrp-faces-volatility-key-levels-and-analyst-forecasts/