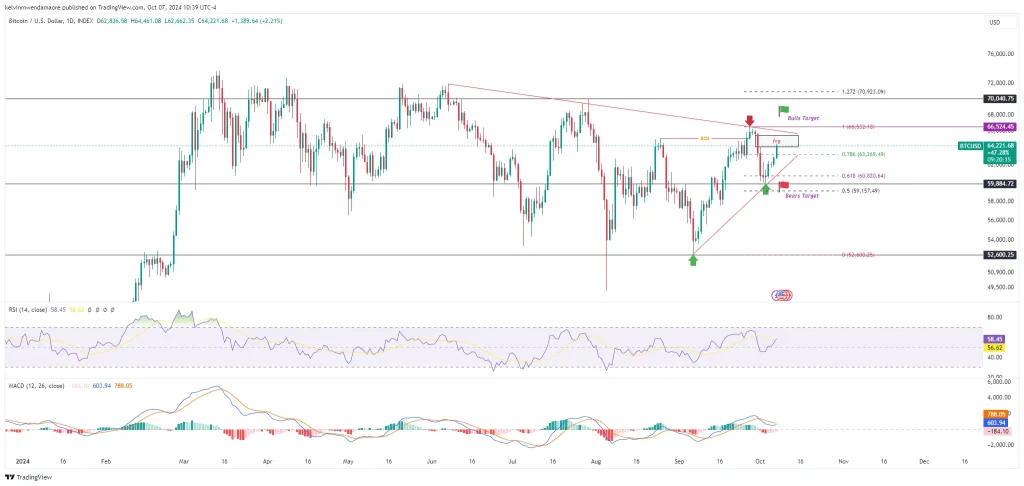
The Bitcoin market has started the week on a strong note, with its price recently climbing back to $64K. TradingView’s 1-day chart data shows the token surged by 2.87% in just 24 hours. This recovery follows a period of uncertainty linked to rising tensions between Iran and Israel, leading many to wonder if recent events involving Donald Trump and Elon Musk contribute to the optimistic outlook.
BTC Price Action and Market Sentiment
Bitcoin trades at approximately $63,403 at press time, suggesting resilience and potential for continued growth. Not to be outdone, the token’s intraday market capitalization has reclaimed its lost ground, currently standing above $1.253 trillion, which reaffirms its status as the dominant cryptocurrency in the market.
Compounding this positive momentum is a 107% surge in trading volume, totalling $25.164 billion in the last day. This increase signals a heightened interest from investors and traders, hinting at potential further price appreciation in the days ahead.
On-Chain Data Indicates Positive Trends
On-chain metrics from CoinGlass reveal encouraging signs for Bitcoin, particularly in its open interest (OI)-weighted funding rate, which remains consistently positive. This trend indicates that long positions are outpacing short ones. Over the last 24 hours, the funding rate has climbed by 0.0035%, showing that traders holding long positions are willing to pay a premium to maintain their stance.
Additionally, the cryptocurrency’s futures volume has surged by 192.70%, reaching $54.32 billion. Open interest in the same period has also increased by 4.52%, now at $34.42 billion. Such data points suggest a robust engagement from the trading community, fostering an environment conducive to price gains.
The RSI is another indicator pointing to a potential bullish continuation. With its value at 58.45 and trending upwards, it indicates sufficient room for price increases before reaching overbought levels. Additionally, the MACD sits at 603.94 and is on the cusp of a bullish crossover with its signal line. These technical signals further bolster the case for upward movement in the cryptocurrency’s price in the near term.
Market Speculation: What Lies Ahead?
With the current indicators pointing toward a bullish scenario, many traders are speculating about Bitcoin’s next moves. The anticipation is that the token could challenge the $66.5K mark, which was last seen on September 27.
Should it breach this level, further upward momentum could propel the token toward the $70K resistance threshold, marking an influential bullish trend in the cryptocurrency market. However, it is essential to acknowledge that market sentiment can shift rapidly. A change in investor outlook could lead Bitcoin to test lower levels, with potential support around the $60K region before another attempt to rally occurs.
Also Read: Meme Coin Market Cap Pumps 7.7%, Defies Overall Market Conditions
Source: https://www.cryptonewsz.com/bitcoin-revisits-64k-is-this-a-bullish-move/


