- EUR/USD extends gains towards the psychological barrier of 1.0800.
- Technical analysis indicates a potential confirmation of bearish momentum for the pair.
- The key support appears around March’s low of 1.0767 and the major level of 1.0750.
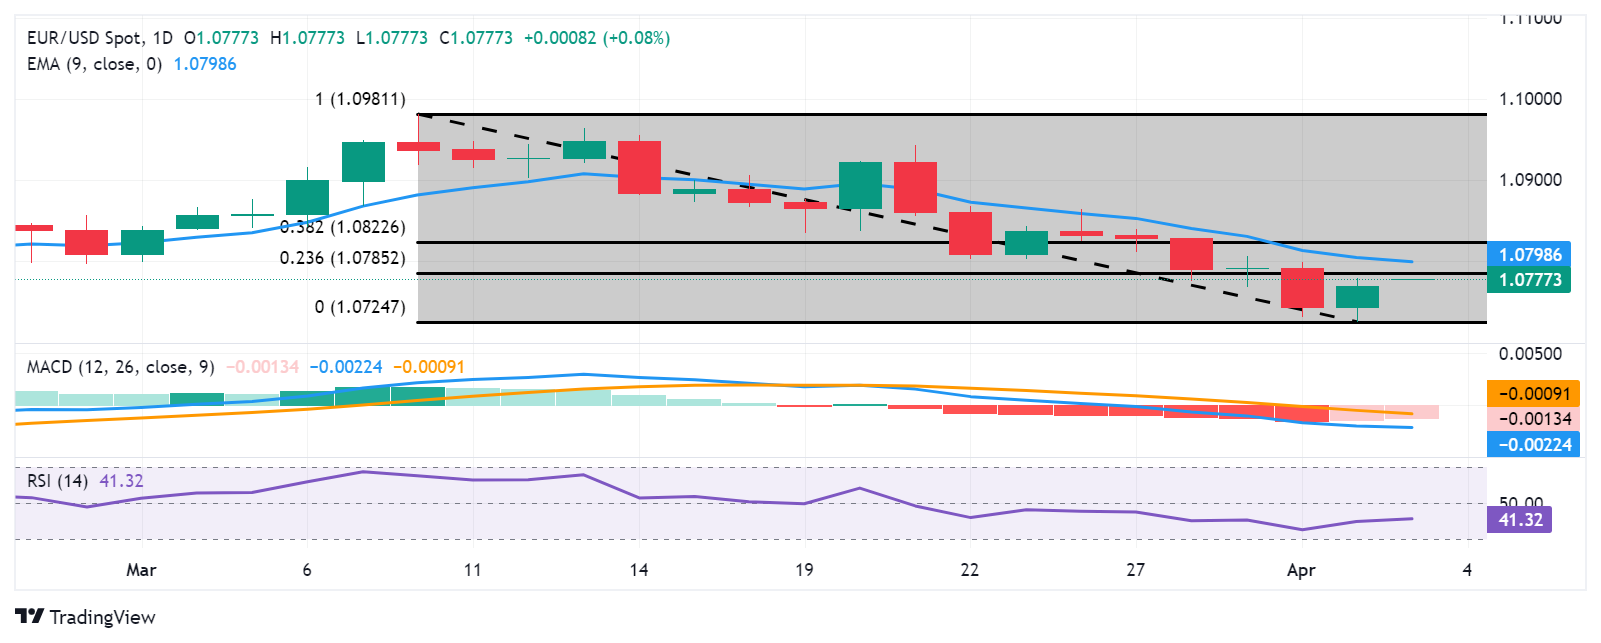
EUR/USD continues its winning streak for the second consecutive session on Wednesday, inching higher to near 1.0780 during the Asian hours. The immediate resistance appears at the 23.6% Fibonacci retracement level of 1.0785.
A breakthrough above this level could exert upward support for the EUR/USD pair to explore the region around the nine-day Exponential Moving Average (EMA) at 1.0798, aligned with the psychological resistance of 1.0800. Further resistance lies at the major level of 1.0850, following the psychological resistance at 1.0900.
Technical analysis suggests a bearish sentiment for the EUR/USD pair. The 14-day Relative Strength Index (RSI) is positioned below the 50 mark, indicating weakness in buying momentum. Additionally, the Moving Average Convergence Divergence (MACD) shows a divergence below the signal line and remains below the centerline. Although a lagging indicator, this alignment indicates a confirmation of the bearish momentum for the EUR/USD pair.
On the downside, immediate support appears at March’s low of 1.0767, followed by the major support at 1.0750. A break below this level could lead the EUR/USD pair to revisit the weekly low of 1.0724, followed by psychological support at the 1.0700 level.
EUR/USD: Daily Chart
Source: https://www.fxstreet.com/news/eur-usd-price-analysis-hovers-near-10780-followed-by-236-fibonacci-retracement-202404030442