Chainlink (LINK) has been on a downward trend since December 2024 from a peak of about $28.00. Currently, LINK trades at $11.36 with a 2.06% decrease in price over the last 24 hours. The token has lost more than 60% of its value since it was last priced at $28.00 four months ago.
Will a reversal take place, or will the price plunge below the $10 support level?
Chainlink Price Analysis
The daily chart for LINK shows a bearishness since December 2024. The price has created multiple lower peaks at important Fib levels $26.71 (0 Fib), $24.38 (0.236 Fib), and $22.95 (0.382 Fib). The recent crash in price shows LINK struggling to hold back support at $10.78.
The EMAs portray a bearish setup, with LINK currently trading beneath all significant EMAs. The 50 and 200 day EMAs exhibit a bearish cross, with the former bearing down more steeply. The price has been consistently rejected by the 50 and 200 EMAs since the beginning of February 2025, with the most recent rejection being at around $16.00 in late March.


The MACD indicator shows bearish momentum, with the MACD line trading below the signal line at -0.95. The histogram is showing -0.22, indicating sustained bearish pressure. Meanwhile, from the end of March to the beginning of April, price movements suggest a bullish divergence establishing itself.
A descending channel that has contained the price of LINK since December. The channel runs from around $28.00 at the December high to the current $11.36 price level. In January, February, and March, the upper resistance trendline has persistently rejected price rally attempts at $24.00, $20.00, and $16.00, respectively, while the lower support line has been tested more frequently.
The LINK price currently finds support at $10.78 level, while below this, the 1.618 Fibonacci extension at $10.78 would serve as critical support. The resistance now appears at immediate levels of $14.19 (1.272 Fib) that coincide with the March 23-28 consolidation area following the psychologically important $16.86 (1.0 Fib), which has rejected price advances twice in March.
LINK Price Targets
If LINK price can maintain support above the $10.78 level, then that could lead to a reversal target of about $14.19. For a major recovery, Chainlink will have to break the upper boundary of the descending channel, which is currently around $16.00. Such a breakout would indicate a reversal of the trend.
On the flip side, if LINK price falls below the support level of $10.78, selling pressure could increase toward the psychological $10.00 level, which is in line with projected channel support.
376 Million LINK Bought Near $6
The analytics platform, Intotheblock, reveals that over 376 million LINK tokens were accumulated around the $6 mark, making it a critical demand wall that could provide support in case of another major drop.

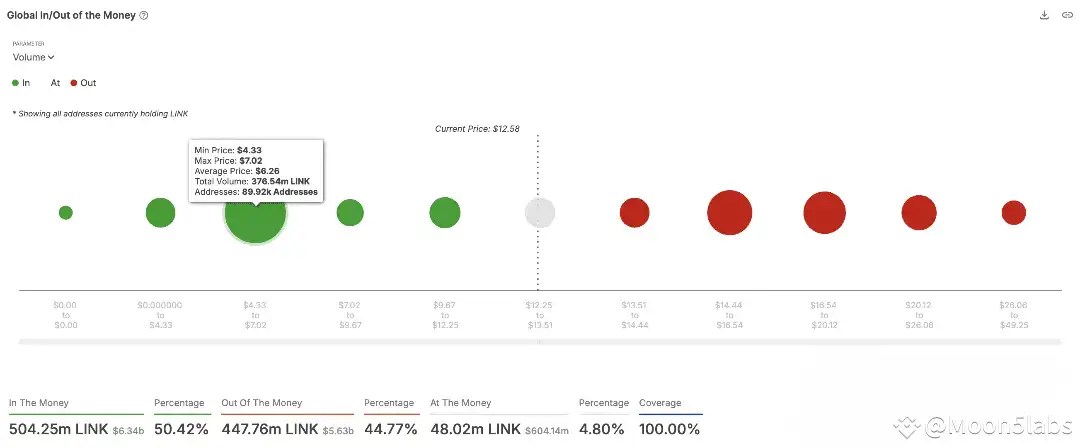
About 50% of holders are in profit, while nearly 45% are in the red. If LINK breaks below $12.25, panic selling could accelerate.
Source: https://www.cryptonewsz.com/chainlink-link-price-trend-sirens-potential-bullish-reversal-buyers-target-16/