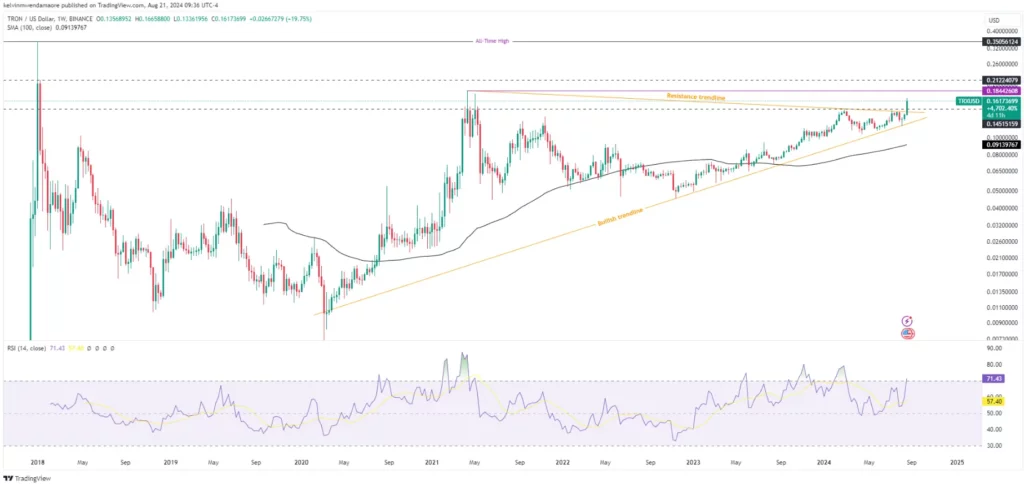
TRX, the native token of the Tron blockchain, has exhibited a solid 3-day bullish streak over the past week, with its value surging to new highs. As of press time, the altcoin exchanged hands at $0.1642, marking a 9.60% uptick in the last 24 hours and a 25.43% spike over the past 7 days.


This optimism surrounding Tron’s ecosystem surged following a recent announcement by its founder, H.E. Justin Sun, on Monday. Sun unveiled plans to incorporate a meme ecosystem on the Tron blockchain, sparking widespread interest among influential community leaders.
Today, I talked with several major meme community leaders about the meme ecosystem on Tron. They said they plan to bring millions of users 🤯 to the Tron community and can’t wait to join the Tron ecosystem as soon as possible. They’re already here—what about you? TO THE SUN🌞
— H.E. Justin Sun 孙宇晨(hiring) (@justinsuntron) August 19, 2024
Interestingly, these leaders have shown strong enthusiasm for joining the altcoin, with ambitions to attract millions of users to the platform. Meanwhile, the asset’s market cap surged to the $14.269 billion threshold, surpassing Cardano to become the 10th largest virtual currency by market capitalization.
Similarly, the altcoin’s 24-hour trading volume followed a similar trend, as it massively gained 119.10% to $1.870 billion.
Tron Breaks Out of Symmetrical Triangle Pattern
As observed on TradingView, the token has broken out to the upside from a symmetrical triangle pattern characterized by a series of lower highs and lower lows. Often associated with a consolidation phase before a massive price movement, this breakout signals a potential bullish rally for the cryptocurrency.
Historically, the digital asset last traded in this region briefly in January 2018 and May 2021 before exhibiting massive price declines. This zone has proven to be an area of unrest, as its prices have spent countable days above the $0.145 level.


Following these scenarios, market analysts anticipate a near-term correction is imminent. The RSI indicator, which presently trends in overbought conditions at 71.43, further supports this projection. This implies the coin may be due for a pullback before resuming its uptrend.
Contrastingly, the 100-day moving average tells a different story. Currently trending in a sluggish upward trend below the asset’s price at $0.0913, it validates the prevailing bullish sentiment in the market, provided its position below the token is held.
Will TRX Pullback?
Should a retreat come into play, market experts forecast that the altcoin might witness its value dip toward the $0.145 mark to find support. A breach below this zone could further pull the coin’s prices to deeper levels, possibly retesting its recent low around the $0.1165 threshold before attempting another bull run.
On the brighter side, TRX is anticipated to challenge its old highs, with the potential to break past $0.1844, last touched on April 12, 2021. The success of this move could reinforce a solid bullish sentiment for the digital currency. As a result, the coin could rally toward its next barrier at the $0.2122 zone.
Also Read: Mt. Gox moves $75 million BTC, Bitcoin steadies above $59K
Source: https://www.cryptonewsz.com/trx-bullish-surge-can-tron-hold-gains-or-dip/