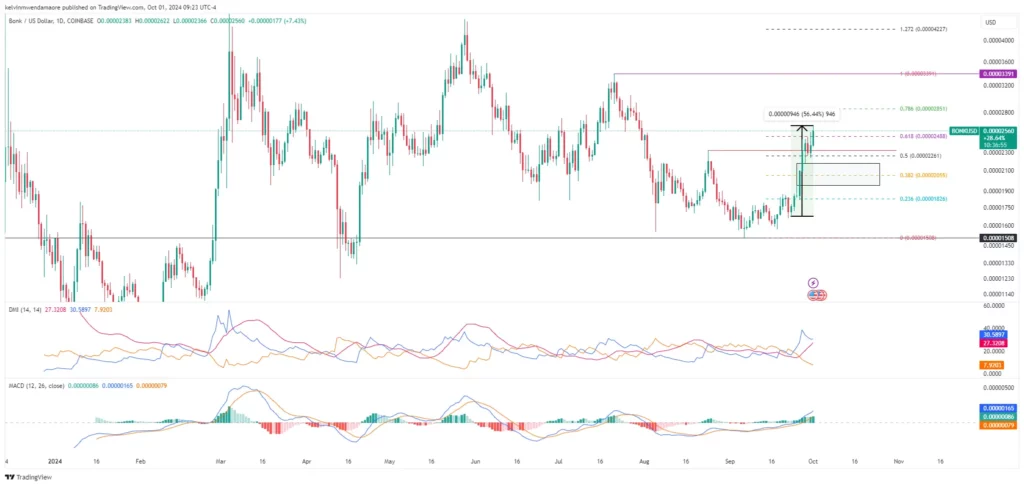
The Solana-based meme coin BONK has surprised the cryptocurrency market with its recent price surge, surpassing the $0.00002324 resistance level. This move has raised speculation about the token’s possibility of challenging its next resistance point at $0.00003391.
According to TradingView’s data, this momentum commenced on September 23, when the altcoin price hit a low of $0.00001676 before rallying more than 56%, reaching a high of $0.00002622. During this period, only one bearish candlestick appeared, highlighting the strength of the ongoing bullish trend.
Price Performance: BONK Leads Today’s Gainers
As of press time, BONK was trading at $0.00002566, recording an 8.60% increase over the last 24 hours, making it the top gainer in the cryptocurrency market. The token’s market cap has also grown significantly, reaching $1.817 billion, positioning it firmly as the 50th largest crypto by market capitalization.
Alongside the price increase, the cryptocurrency’s 24-hour trading volume surged by 38.52% to $481,564,937, further supporting the current bullish sentiment. Interestingly, while BONK continues its upward trend, the broader cryptocurrency market experienced a slight decline, with its overall market capitalization slipping by 0.15% to $2.15 trillion. In contrast, the market’s 24-hour trading volume climbed by 4.02%, reflecting a growing optimistic sentiment in some areas, including BONK.
Technical Indicators Suggest Further Upside Potential
Technical indicators point to continued upward momentum for BONK in the short term. For instance, the Directional Movement Index (DMI) reveals a positive outlook for the meme coin, with the +DI at 30.5897, relatively higher than the -DI reading of 7.9203. This indicates that the bulls currently dominate the market. Additionally, the Average Directional Index (ADX), sitting at 27.3208, signals the strength of the ongoing trend. Typically, an ADX reading above 25 confirms a strong trend, suggesting that the bullish momentum in the token is solid.
Adding to this positive market outlook, the Moving Average Convergence Divergence indicator also shows upward momentum. The MACD index stands at 0.00000165, with the MACD histogram displaying increasing green bars above the zero line, indicating continued strength from buyers in the market.
Further supporting this bullish trend, on-chain data from CoinGlass shows an increase in the open interest-weighted funding rate, which rose by 0.0083%. This reflects growing long positions in BONK, implying that traders are increasingly confident in the cryptocurrency’s near-term price appreciation. This rise in long positions reinforces the market’s belief that the current upward momentum may continue.
Could BONK Reach $0.00003391?
With market indicators and sentiment leaning toward a bullish outlook, the token may soon challenge its next resistance at $0.00002851, which aligns with the 78.6% Fibonacci retracement level. If the cryptocurrency successfully breaches this level, it could continue its upward trajectory toward $0.00003049, a price last seen in late July.
Breaking through this point could pave the way for the meme coin to test the key $0.00003391 resistance level in the near future. However, traders are advised to remain cautious. While the current trend is bullish, over-optimism could lead to overbought conditions, potentially causing a market correction. Should this happen, BONK may retrace to its previous support at $0.00002324 or fall further to $0.00002055 before resuming its upward momentum.
Also Read: Daily Crypto Update: Market Goes Neutral After A Slight Slump
Source: https://www.cryptonewsz.com/bonk-breaks-past-barrier-is-0-00003391-next/


