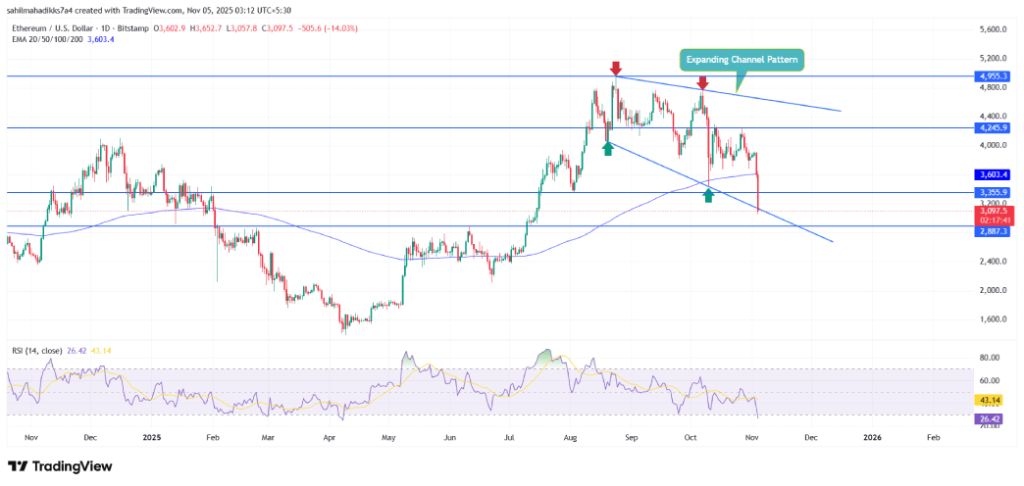
- The Ethereum price gives a breakdown below the bottom trendline of the expanding channel pattern of the daily chart.
- Tuesday’s sell-off in the crypto market triggered a total liquidation of $1.99 billion across 450,642 traders, according to Coinglass data.
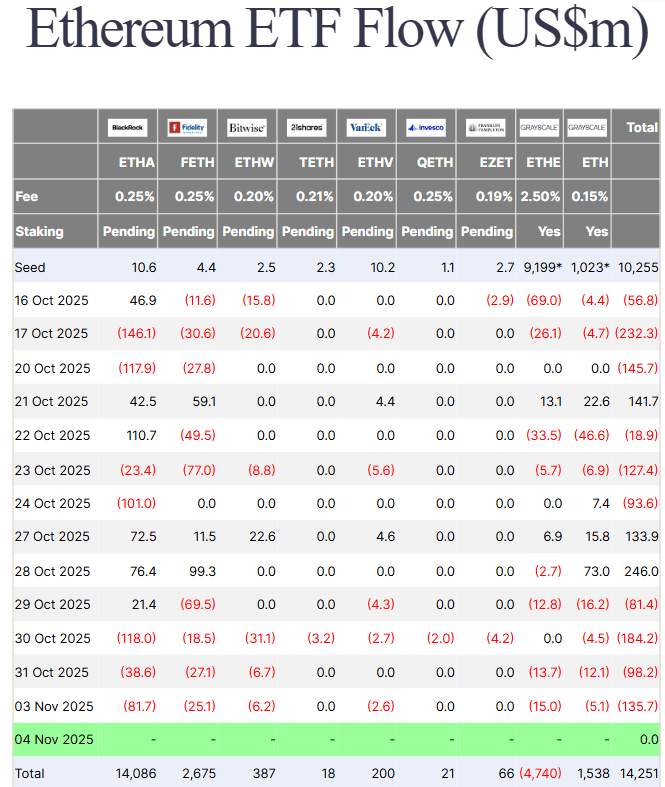
- The spot Ethereum ETFs in the U.S. saw consistent outflows over the past four days.
- ETH’s fear and greed down to 28% accentuates a bearish sentiment among crypto participants.
Ethereum, the second-largest cryptocurrency by market capitalization, plunged over 13% during Tuesday’s U.S. market hours to trade at $3,057, its lowest since mid-July. The selling pressure is widely spread across the crypto market, as the Bitcoin price breaks below the $100,000 mark. The major factors contributing to this downtrend include the strengthening U.S. dollar, ETF outflows, and cascading liquidation in the futures market. Will Ethereum price lose $3,000 floor?
ETH Faces Heavy Liquidations, ETF Outflows, and Strong Dollar Pressure
Over the past week, the Ethereum price has shown a significant correlation from $4,250 to the current trading value of $3,057, projecting a 28% loss. Subsequently, the asset’s market cap plunged to $387.29 billion.
Along with the U.S.-China trade tension, this downside gained its initial momentum last week as Federal Reserve Chairman Jerome Powell projected a hawkish tone for the December rate cut. This led to a risk-off sentiment in riskier assets, such as cryptocurrencies.
Following the FOMC meeting, the U.S. dollar gained strength and pushed DXY to a three-month high of 99.87. As the majority of major cryptocurrencies are traded against the dollar, their negative correlation makes the crypto market expensive for investors and adds downward pressure on their prices.
Another reason for the recent downtrend is the continuous outflows from the U.S.-based spot Ethereum Exchange-Traded Funds (ETFs) over the past four days. Based on data from Farside Investors, cumulative outflows in spot ETH ETFs on November 3rd were pegged at around $135.7 million, indicating a wave of investor profit-taking and institutional demand withdrawal in the context of general market uncertainty.
The 11% drop in Ethereum price today accelerated market volatility and triggered a liquidation cascade on major exchanges. According to data from Coinglass, long positions in Ethereum were liquidated for more than $572 million, which is one of the largest single-day liquidations since the October 10th sell-off.
This sharp selloff highlights the precarious nature of leveraged positions and underscores the increasing prudence among traders in a market where sentiment is trending toward a risk-averse stance.
Ethereum Price Breaks Below Monthly Support of Channel Pattern
Over the past two weeks, the Ethereum price showed a steady correction resonating within two downsloping trendlines of an expanding channel pattern. The chart setup reflects two diverging trendlines, which theoretically indicate increasing market uncertainty.
With today’s downtick, the Ethereum price gives a bearish breakdown below the bottom trendline, reflecting an aggressive selling pressure in the market. If the daily candlestick is below the bottom trendline, the seller puts further symptoms directly over this asset for a prolonged downfall towards $2,887, followed by an extended push towards $2,388.
The coin price below the 200-day exponential moving average reflects a supportive bearish sentiment for further downtrend.


On the contrary, the momentum indicator RSI (Relative Strength Index) has plunged into the oversold region at 27%, which is viewed as a discount opportunity for investors. If the coin buyers manage to hold the bottom trend, the ETH price could attempt to regain bullish momentum for a bullish rebound.
Source: https://www.cryptonewsz.com/why-is-ethereum-price-down-13-today/

