- Solana’s 7-day average transaction fees have consistently outpaced Ethereum’s since January
- Its trading volume has also outpaced Ethereum’s over the past few months.
Solana has outpaced Ethereum in transaction fees over the last seven days, maintaining a significant lead since 9 January. While Solana’s fee dominance weakened in February, the weekly difference remains above $3 million, indicating sustained relative strength over Ethereum.
This shift raises questions about market preference and whether Solana’s increasing activity could translate into higher adoption and price gains.
Solana’s fee growth and market position
According to the latest data, Solana’s total transaction fees have consistently outpaced Ethereum’s since early January. Despite some fluctuations, the recent weekly difference exceeding $3 million alluded to growing preference for Solana’s network.
In fact, data from Glassnode highlighted the trend, showing Solana’s fees maintaining dominance over Ethereum’s for an extended period.
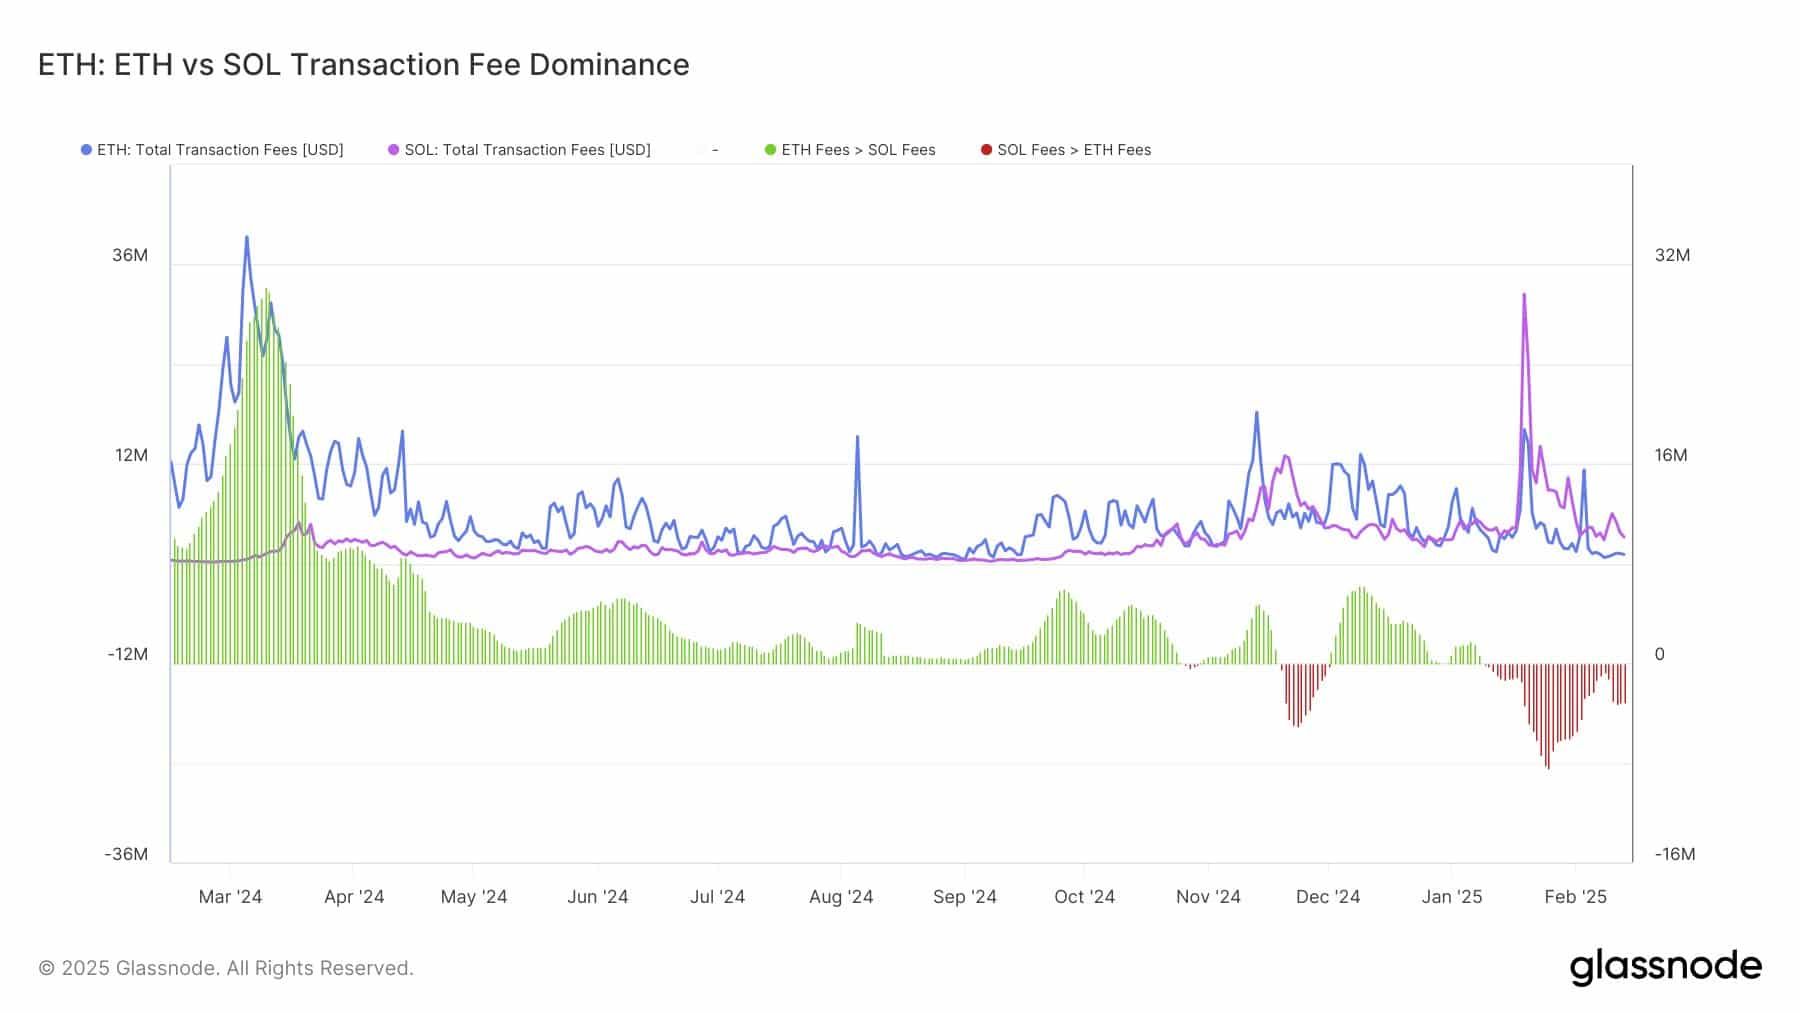

Source: Glassnode
A closer look at DeFiLlama’s data revealed that Solana’s trading volume has also remained strong.
Its cumulative volume in recent weeks has surged, indicating sustained network activity. However, Ethereum continues to command higher total fees in absolute terms due to its vast DeFi ecosystem and broader adoption.
Trading volume comparison – Ethereum vs. Solana
While Solana’s transaction fees have surpassed Ethereum’s, its trading volume remains a crucial metric to watch.
Consider this – Data from DeFiLlama showed that compared to Ethereum, Solana has also seen more volume in the last few months.
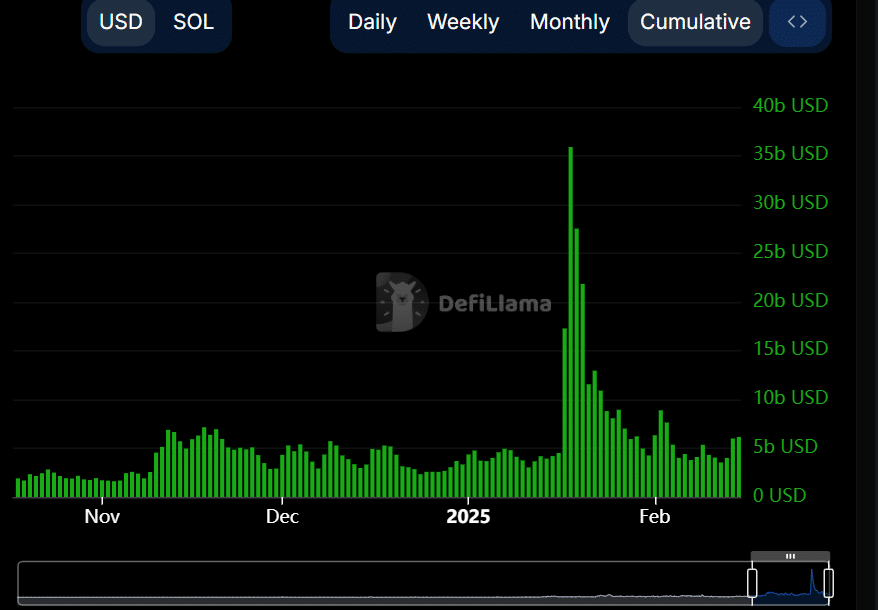

Source: DefiLlama
At the time of writing, the analysis showed that over the last four months, the highest volume Ethereum had seen was a spike to over $7.6 billion on 3 February.
However, the highest for Solana was a spike to over $35 billion on 18 January.
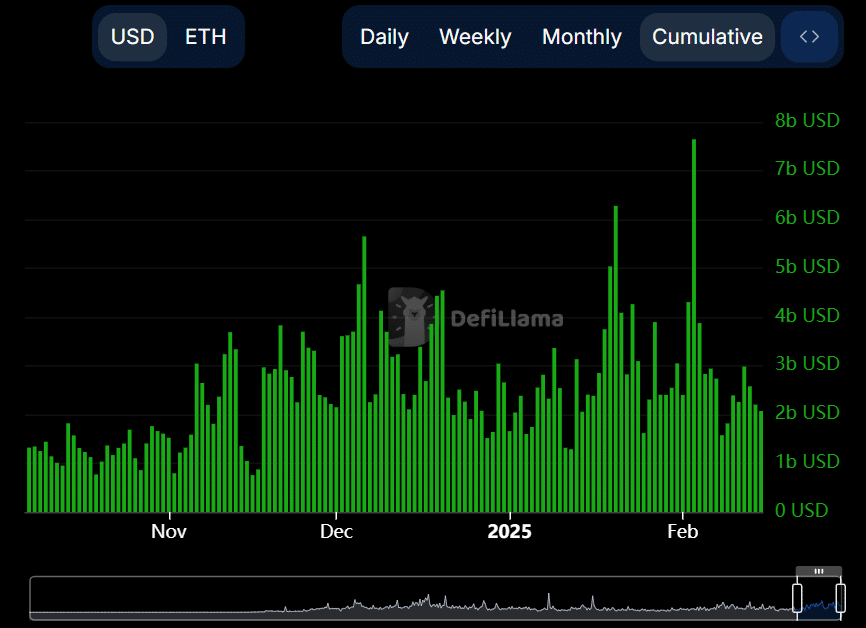

Source: DefiLlama
The comparison between Ethereum and Solana’s trading volume highlights a key aspect—Higher fees indicate increasing demand, but volume ultimately determines liquidity and broader adoption.
Solana’s ability to maintain its fee lead while closing the volume gap could signal a more fundamental market shift.
SOL’s price outlook and market implications
Solana’s price has been relatively stable, despite these fundamental shifts. The latest price chart indicated SOL trading at $196.27, following a 1.58% drop in the last 24 hours. The 50-day moving average was $212.35, while the 200-day moving average was $183.31 – A sign of mixed signals for traders.
If Solana maintains its fee dominance and continues to close the trading volume gap with Ethereum, its price could see some upward momentum.
However, Ethereum’s position in the DeFi ecosystem will present a challenge for Solana in maintaining long-term superiority in transaction fees.
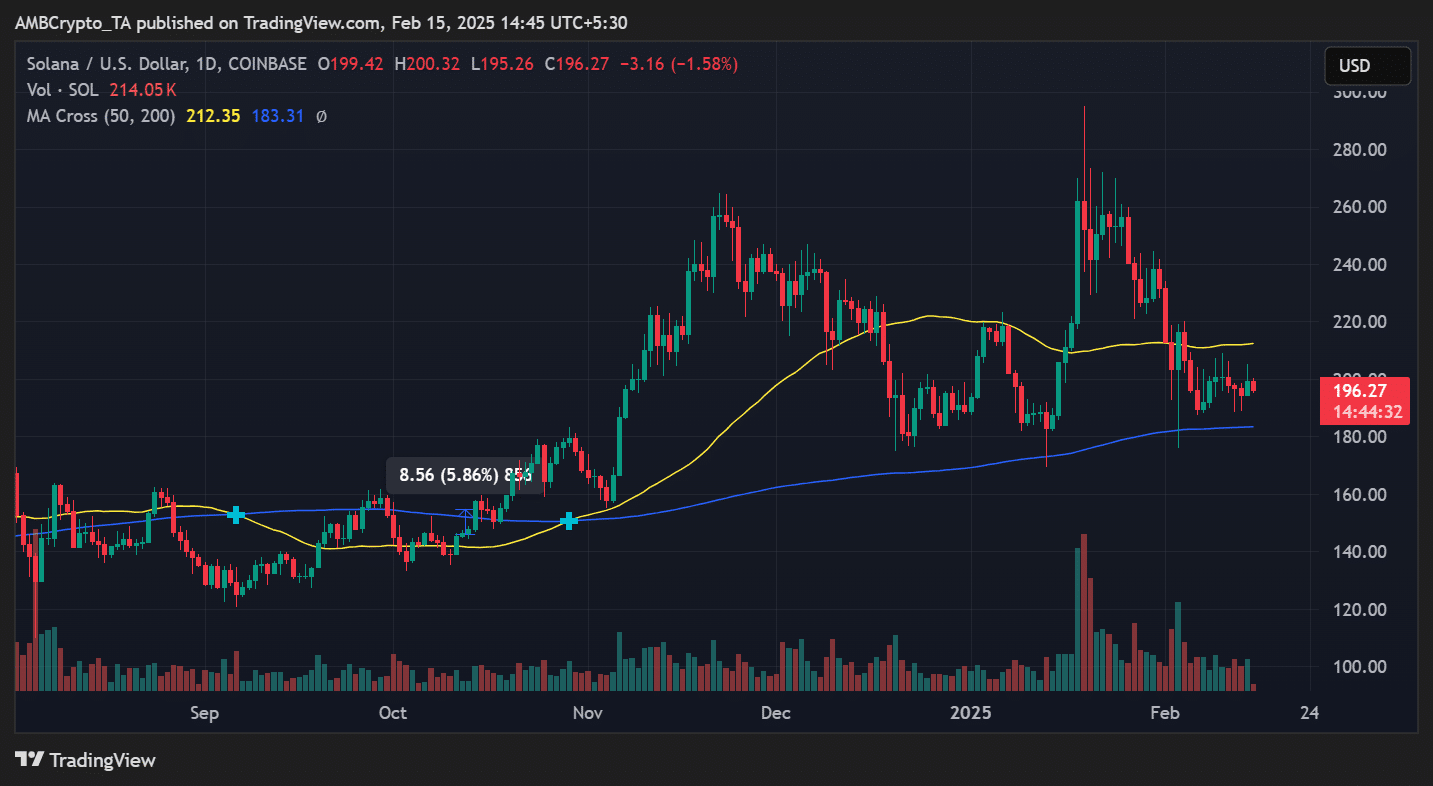

Source: TradingView
With network fees acting as a proxy for demand, Solana’s sustained strength in this metric might hint at a shifting narrative. Whether it leads to fuel greater adoption and a stronger price rally remains to be seen, but what is evident is that Solana is solidifying its position in the market.
Source: https://ambcrypto.com/solana-vs-ethereum-transaction-fees-volumes-price-and-more/