Key Takeaways
Have BTC and ETH seen similar growth levels in fund holdings?
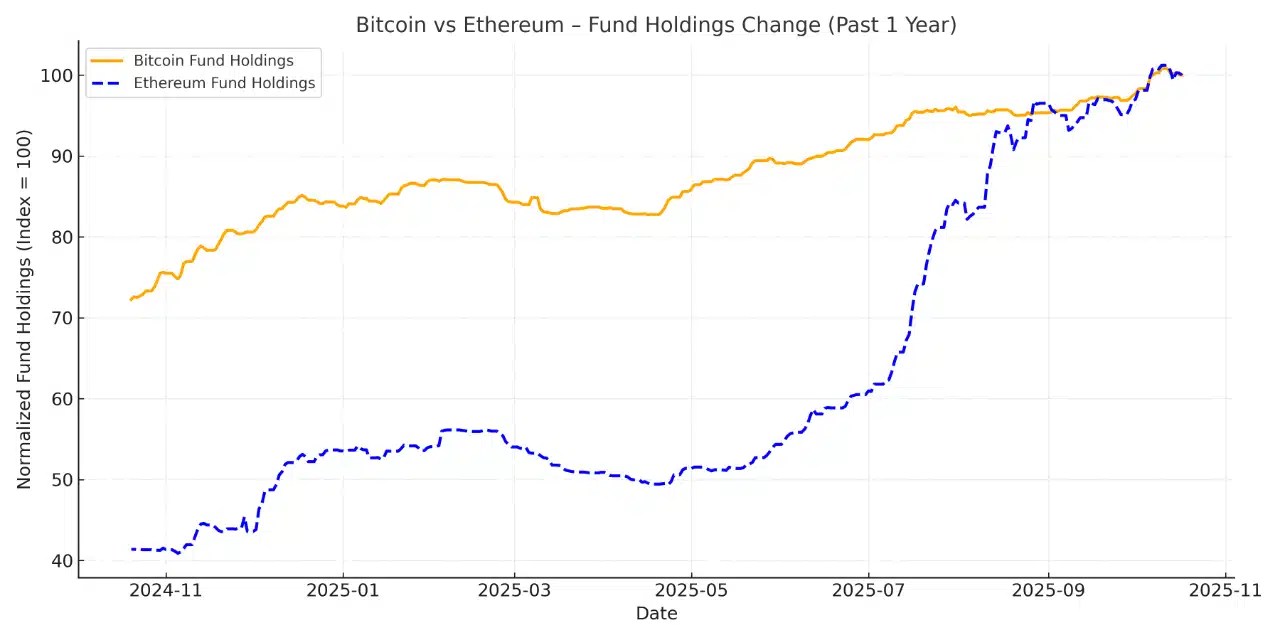
No, the normalized fund holdings showed Ethereum saw a more explosive growth in recent months, showing investor interest in the smart contract economy.
Will this increased demand spur Ethereum to all-time highs?
It can, but likely not immediately. The bearish price structure for ETH on the 1-day chart meant that $4.3k and $4.7k were critical resistance levels to be breached.
The spot exchange-traded funds (ETFs) flows were a mixed bag for Ethereum [ETH] last week. Two days saw positive flows, and three saw negative flows, in contrast to the bullish start to October.


Source: Farside Investors
The volatility on Friday, the 10th of October, has rattled investor confidence in the short term. However, institutional investors maintained bullish conviction in Ethereum.
Comparing the growth of Bitcoin [BTC] and Ethereum fund holdings revealed an encouraging pattern.

Source: CryptoQuant
In a post on CryptoQuant Insights, XWIN Research Japan weighed up the growth of Bitcoin and Ethereum fund holdings.
Over the past year, Bitcoin fund holdings rose at a steady pace, from 1 million BTC to 1.3 million BTC at press time.
This reflected steady accumulation despite periods of market volatility. The steady ETF flows over the past year and the “inflation hedge, digital gold” narratives meant investor confidence in BTC was solid.
By comparison, Ethereum fund holdings leapt from 2.8 million ETH to 6.9 million ETH in the same period. The holdings grew 30% for Bitcoin, compared to 145% for Ethereum.
The ETH spot ETF approval in the summer market, a structural shift in capital allocation, opined XWIN Research.
Institutions are now seeking higher growth in Ethereum from staking yields and DeFi integration.
Warning sign amidst bullish expectations for ETH


Source: Ali on X
In a post on X, crypto analyst Ali Martinez noted why a major price drop could be in store. The MVRV momentum metric plotted the MVRV ratio and its 160-day moving average.
If the ratio crosses below the moving average, it signals bearish momentum. Recently, such a crossover has materialized. The last time this happened was in January. A correction from $3.3k to $1.5k soon followed.


Source: ETH/USDT on TradingView
AMBCrypto found that the market structure on the 1-day chart remained bearish. It flipped bearishly in mid-September (white), and the new swing low was broken again on the 10th of October (dotted white).
At the time of writing, the $3.8k level acted as support, but the structure and momentum were in bearish hands. The OBV has fallen below a multi-month support, signaling increased selling pressure in October.
It is possible that ETH would rally to $4.3k in the coming days. Given the bearish structure, swing traders should be wary of going long unless $4.3k is flipped to support.