As Bitcoin jumped 3.18% last night, making a bullish engulfing candle, the altcoin market comes back to life. With the biggest altcoin copying a similar trend, the buyers are back for Ethereum.
Will this recovery run in Ethereum continue to reach the $3000 mark as it gains strength against Bitcoin? Let’s find out.
Ethereum Price Jump Highlights Strong Demand at $2400
The second biggest altcoin in the crypto industry, Ethereum, reclaimed the $300 billion market cap and has increased by 2.92% in the past 24 hours. The ETH token is currently trading at $2,521, up 4.61% last night, leading to a bullish engulfing candle.

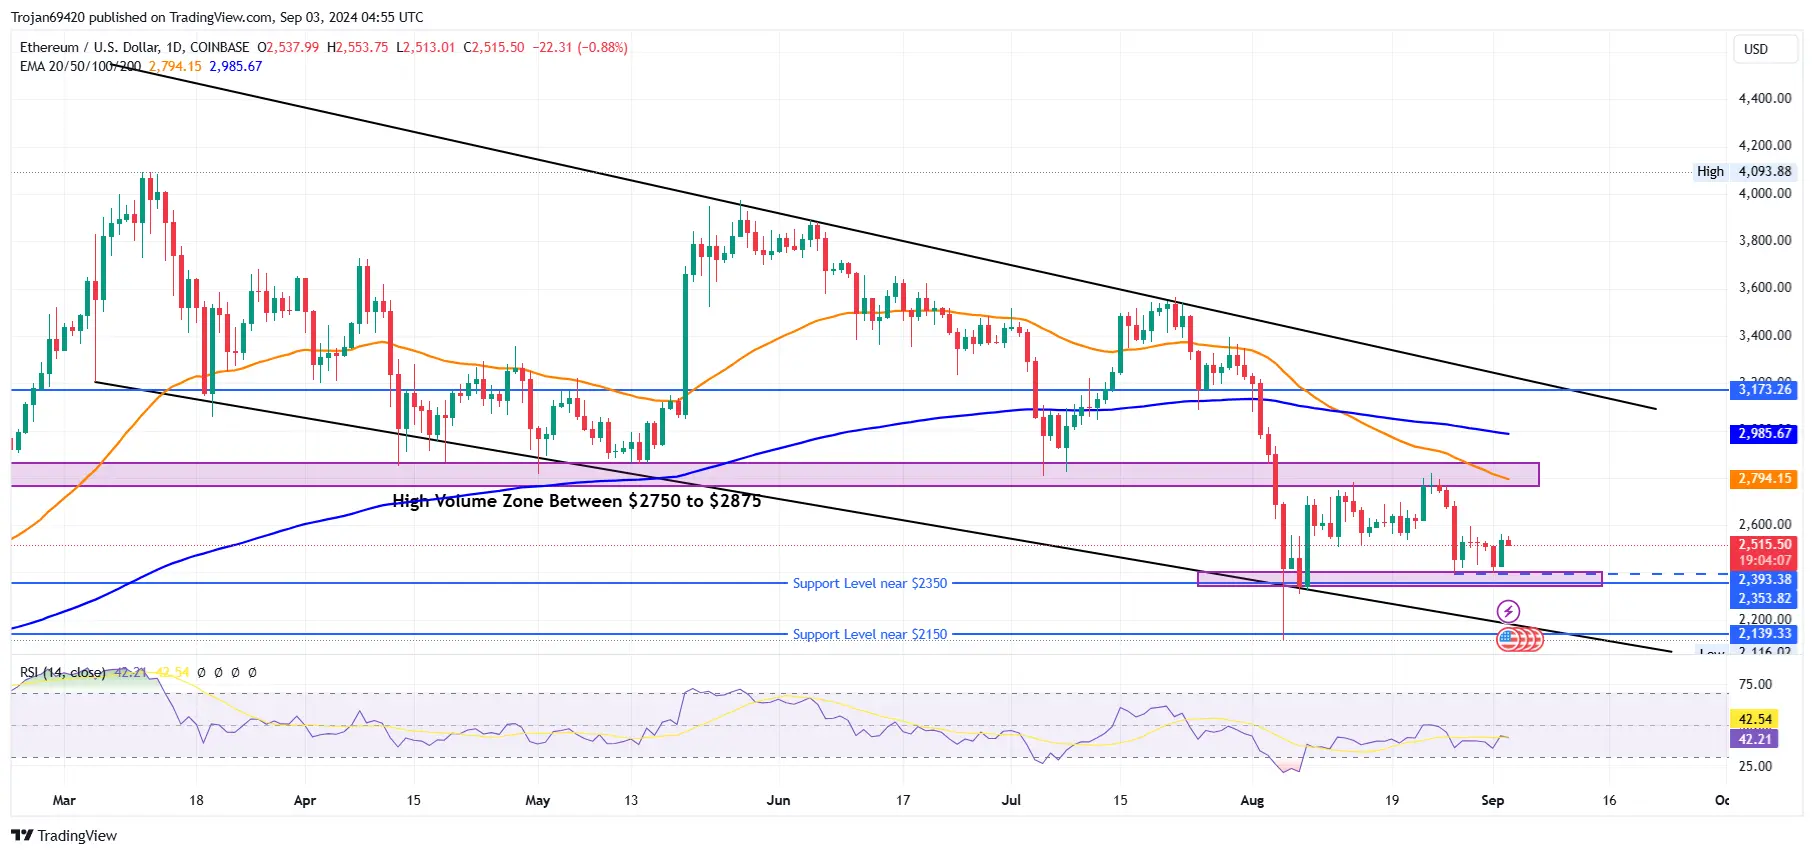
In the daily chart, the ETH price is trading in a falling-channel pattern, but the bottom support at $2,400 supply zone remains unbroken. Furthermore, the recovery run undermines the 3.45% drop on Sunday and teases a bullish reversal.
With a potential double-bottom pattern arising at this support level, the bullish divergence in the RSI line increases the chances of a reversal rally.
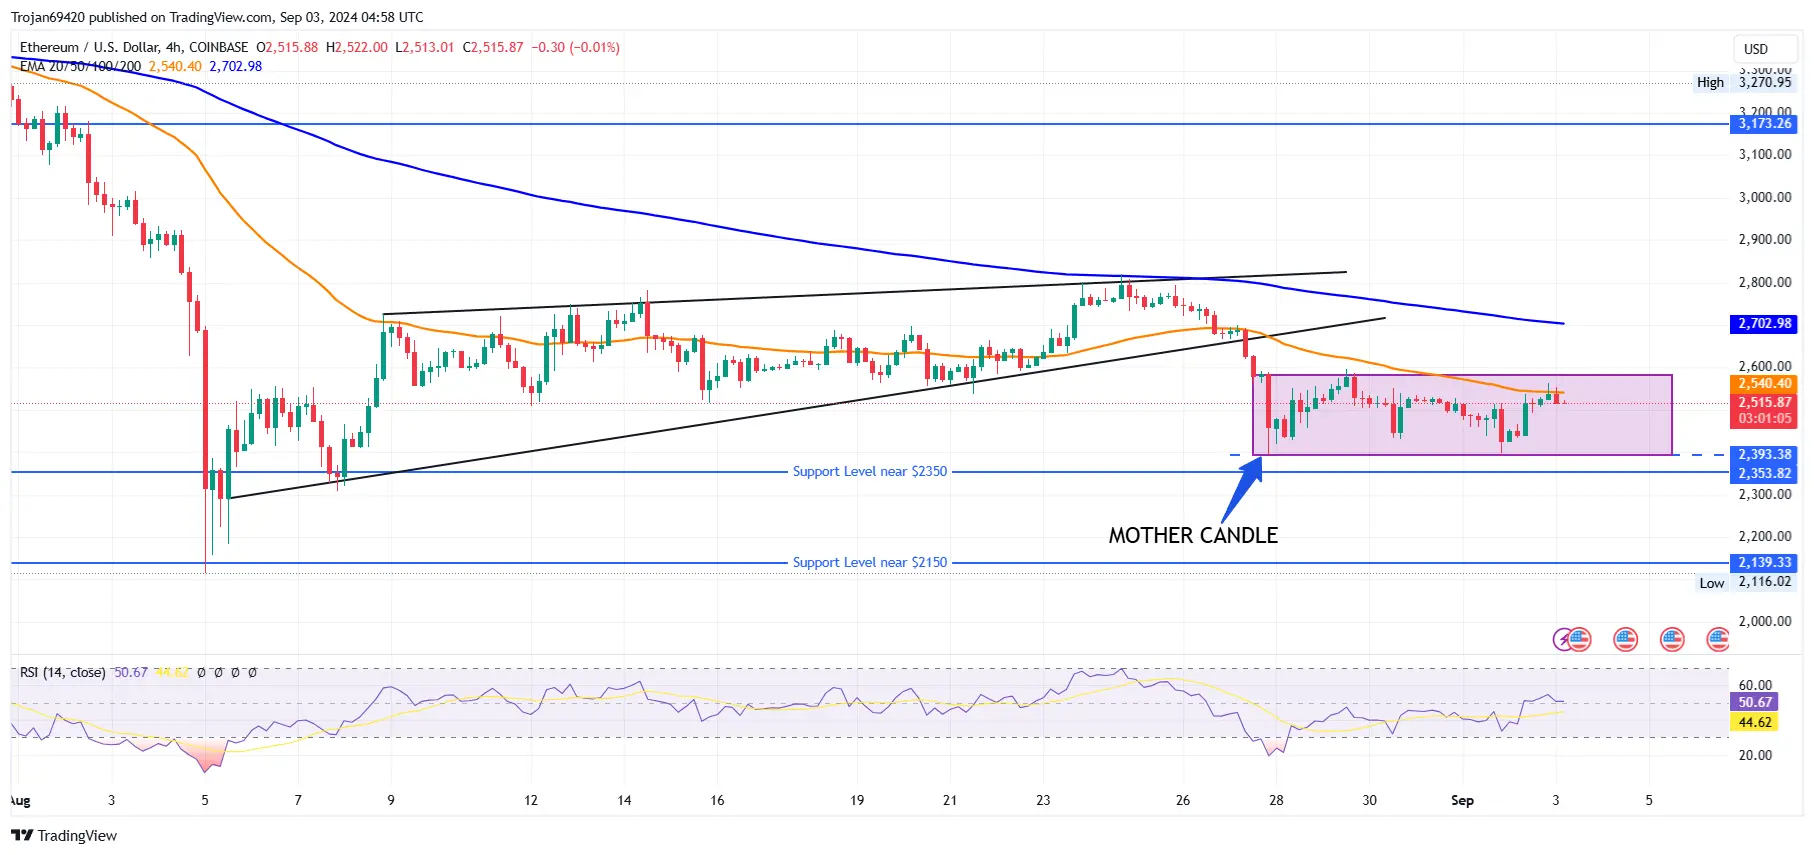
In the 4-hour chart, a consolidation range is visible, extending from the bottom support at $2,393 to the ceiling of $2,581. The consolidation range acts between a mother candle formed on 27 August; hence, the breakout of this candle’s range will be a critical entry point.
Furthermore, the 50-EMA in the 4-hour chart acts as a dynamic resistance and results in a 0.85% drop to keep the bullish growth under check.
Source: Trading View
However, the bullish divergence within the consolidation range is crystal clear and increases the chances of a breakout rally. The price action traders can find the breakout event as a potential entry opportunity, with the target levels at $2,700 and $3,173 in the short term.
Despite Low Whale Activity, ETH Grows Stronger
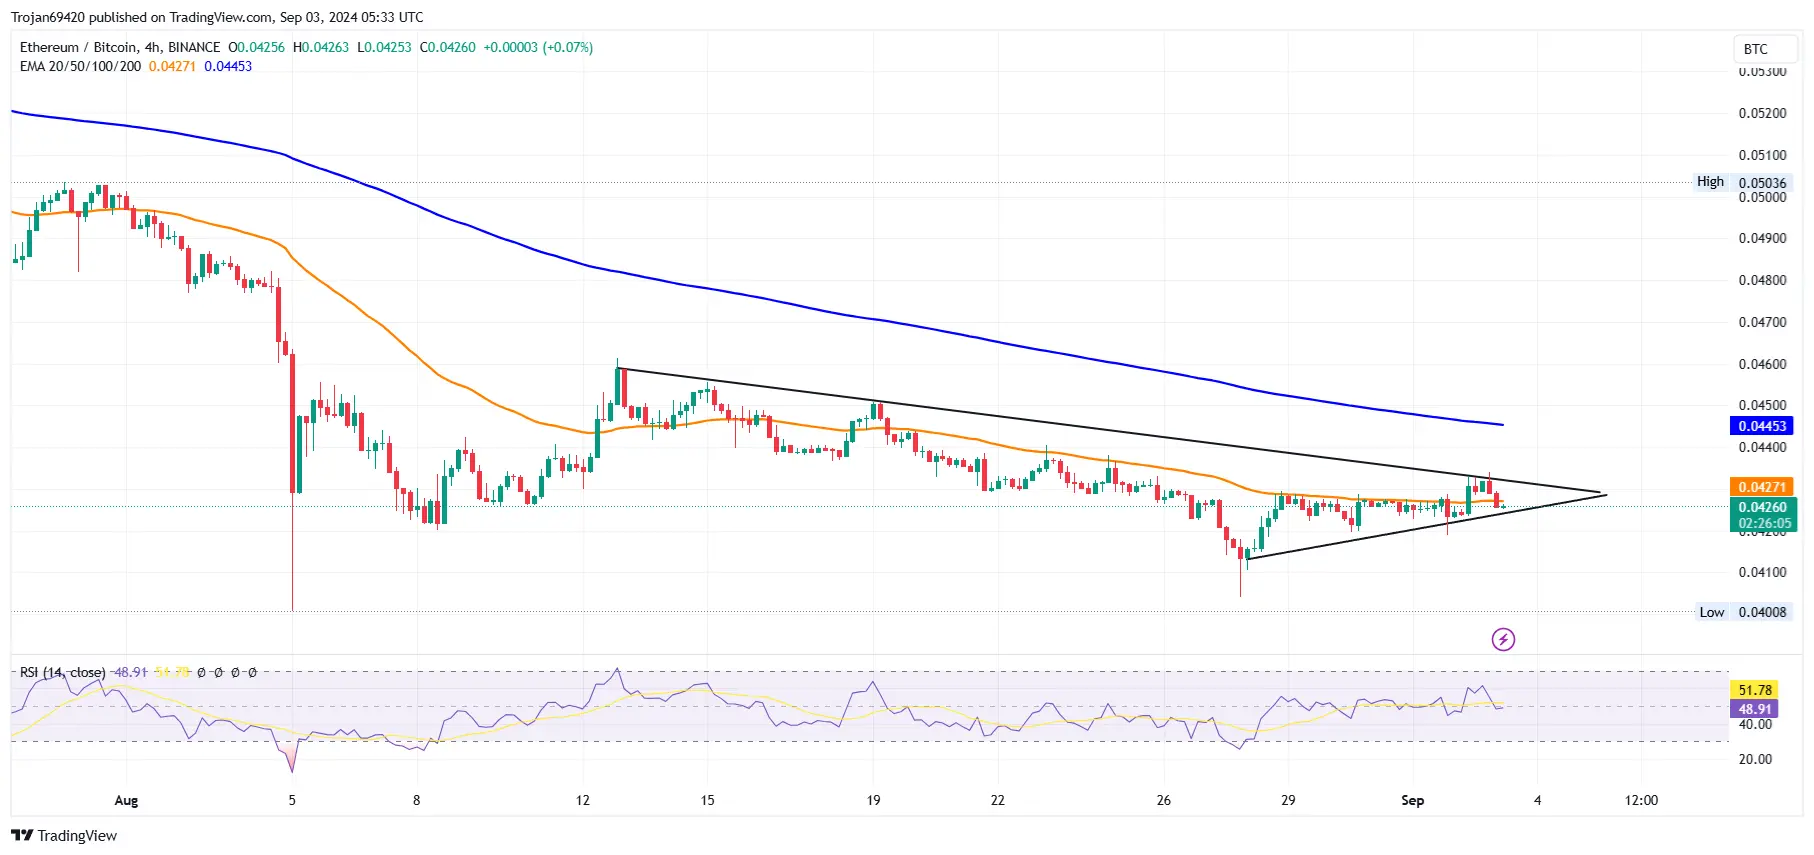
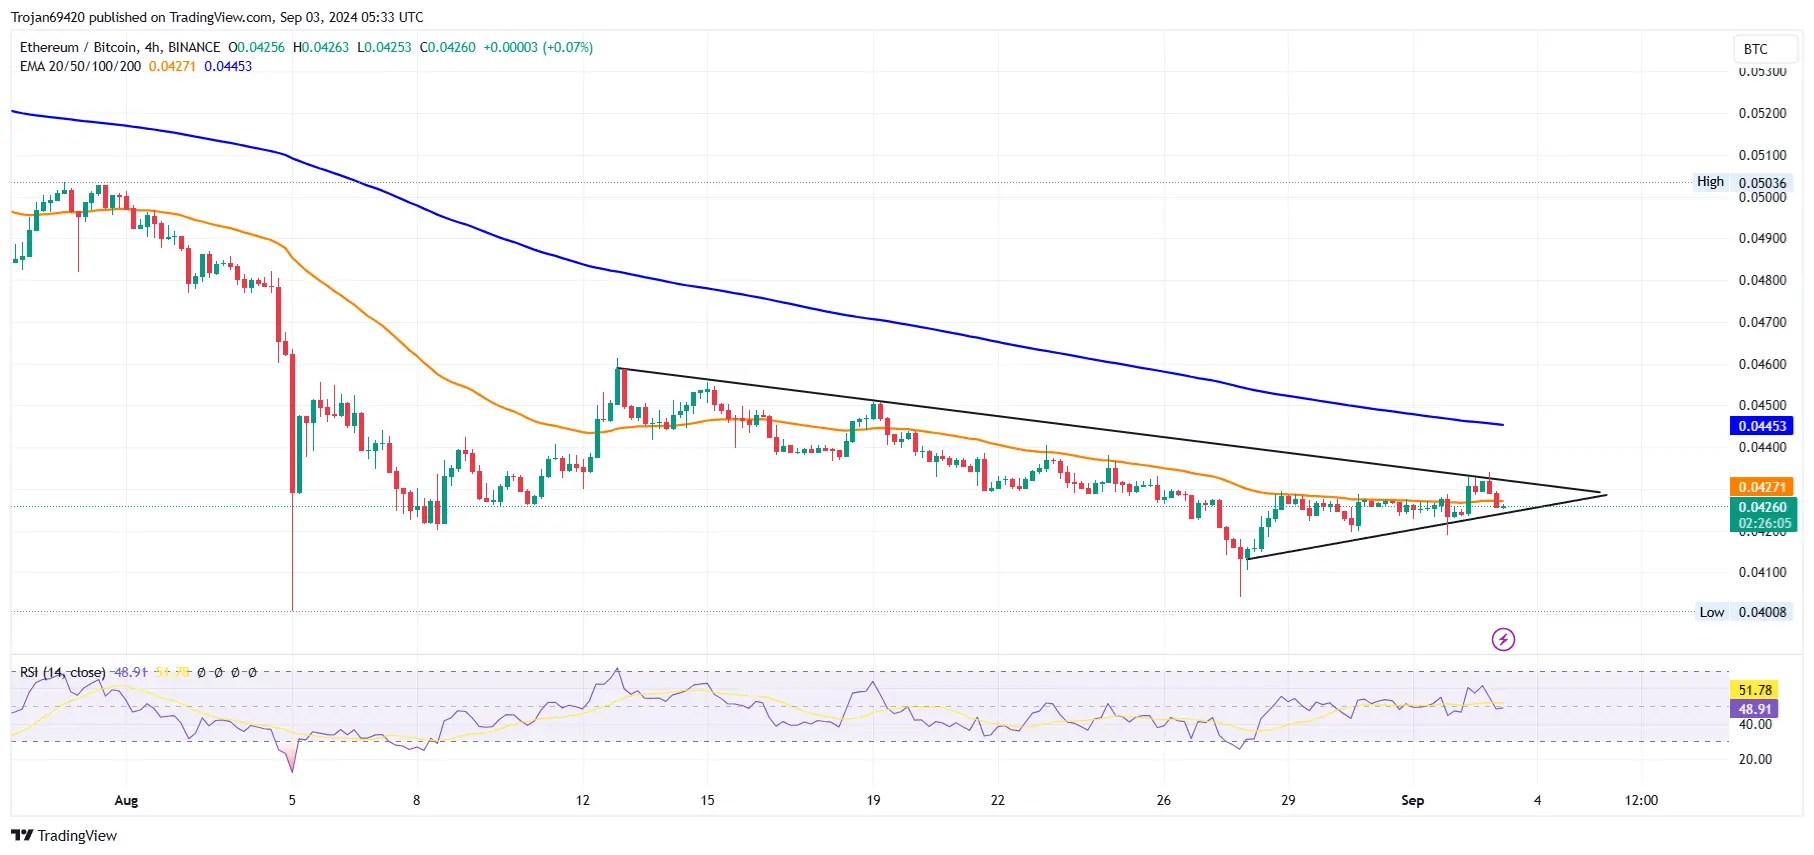
The ETH-BTC pair shows a triangle pattern in the 4-hour chart, supporting the breakout chances in the Ethereum price trend. Further, the uptrend in the ETH-BTC pair shows a minor strength recovery of Ethereum and increases the chances of an altcoin season.
Source: Trading view
Currently, at the baseline and at a value of 0.04260 BTC, the ETH is likely to challenge the overhead trendline as it approaches the bottleneck part of the triangle pattern. A potential breakout rally could
However, based on the recent tweet from Santiment, the decline in whale activity in 2024 is becoming more noticeable. Compared to the 115.1k Whale transactions peak in mid-March, the last week of August registered only 31.8K Whale transactions.
Similar declinations are visible in Bitcoin and other altcoins, straining the market. However, the lack of whale activity is better than the Whale selling activity. As long as the top addresses continue to HOLD, the ETH price will likely trend higher.
Will Ethereum Reach $3,000?
Based on the Ethereum price action, the bullish recovery increases a double-bottom reversal opportunity in the daily chart. However, the massive supply zone present near the $2750 level will likely dent the recovery run.
Further, the declining 50-day and 200-day EMA will continue to act as dynamic resistances.
Hence, the presence of critical resistance in close proximity suggests a highly volatile trend for Ethereum above $2500. However, a broader market recovery will likely result in an uptrend.
Read More: Ethereum Price Prediction
Disclaimer: The analytical piece aims to provide data to investors, with no intention to serve as investment advice. Do your research before planning to invest in the cryptocurrency.
Source: https://www.cryptonewsz.com/ethereum-targets-3000-bulls-surpass-2500/
