Ethereum price begins the session under heavy pressure after today’s sharp crypto market crash erased gains across major assets and pushed ETH down by more than 10%. The sell-off drove the token straight into a region that holds strong relevance for long-term ETH price outlook discussions.
The sudden drop follows weeks of declining structure, and the reaction confirms the current technical weakness on the chart. Meanwhile, the fall brings ETH close to levels that often attract dip-buy interest during deep corrections. Therefore, this setup builds a fresh narrative around how the next move develops around key support.
Ethereum Price Analysis As Bears Press Toward A Critical Retest Zone
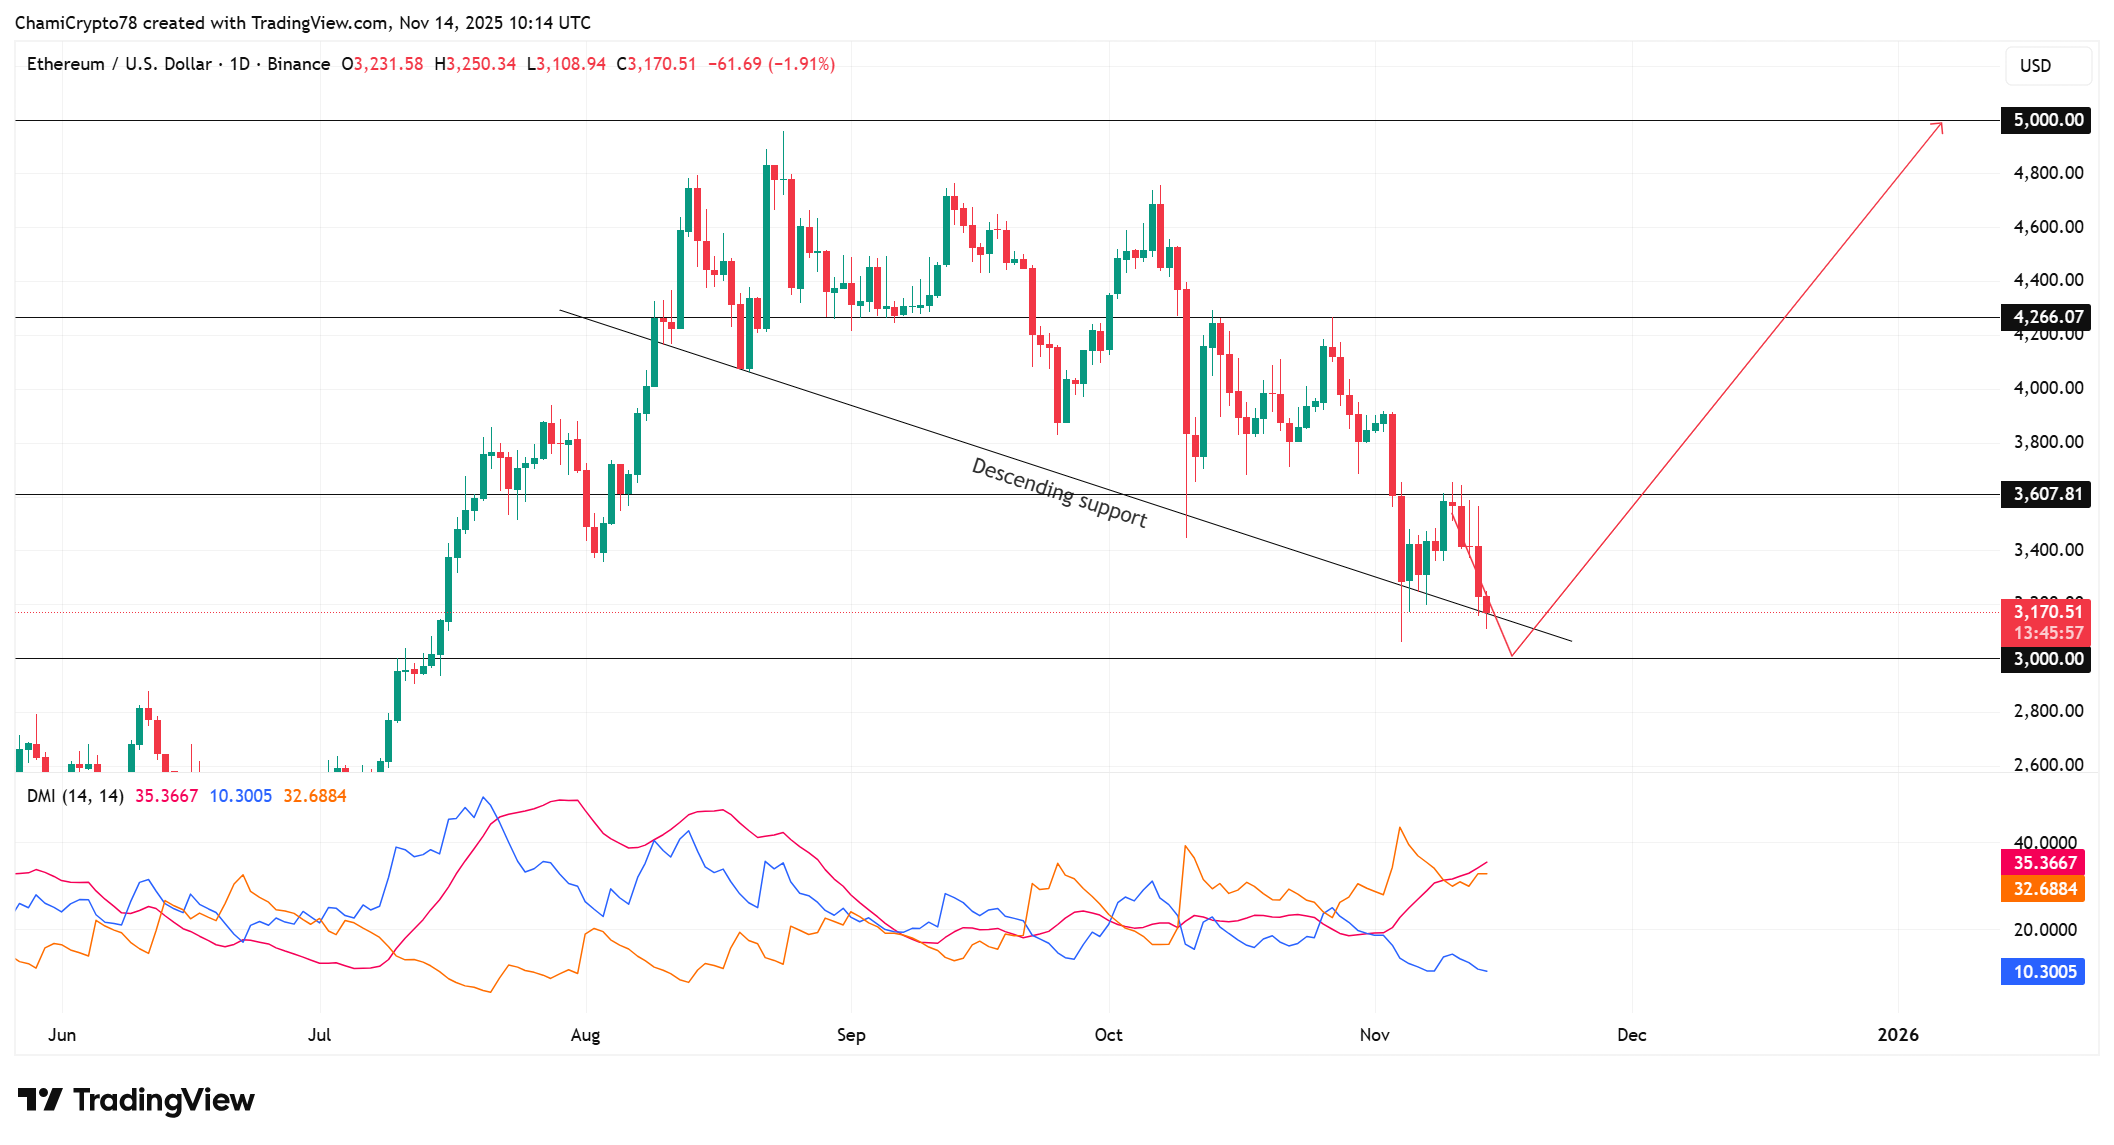
ETH price action extends a clear downtrend that began after repeated failures near the $4,200 region, and the chart now shows a clean sequence of lower highs that confirms this decline.
Ethereum price broke below the descending support, and the move dragged the token toward the region that often anchors long-term ETH price outlook debates. The current ETH value sits near $3,169, and this position shows how sellers control the recent sessions.
However, the chart also highlights a possible retest of $3,000 before any meaningful rebound forms, after today’s market-wide crash. The DMI lines support this view since the +DI remains weak while the –DI stays elevated, and this alignment strengthens bearish behavior.
Meanwhile, the ADX holds above the threshold that confirms strong directional pressure, and this reinforces the current slide. Furthermore, price now trades directly under the broken trendline, and this setup often invites one more dip before any sustainable reaction forms.

Heavy ETH Accumulation At $3,150 Creates A Crucial Pivot For The Next Move
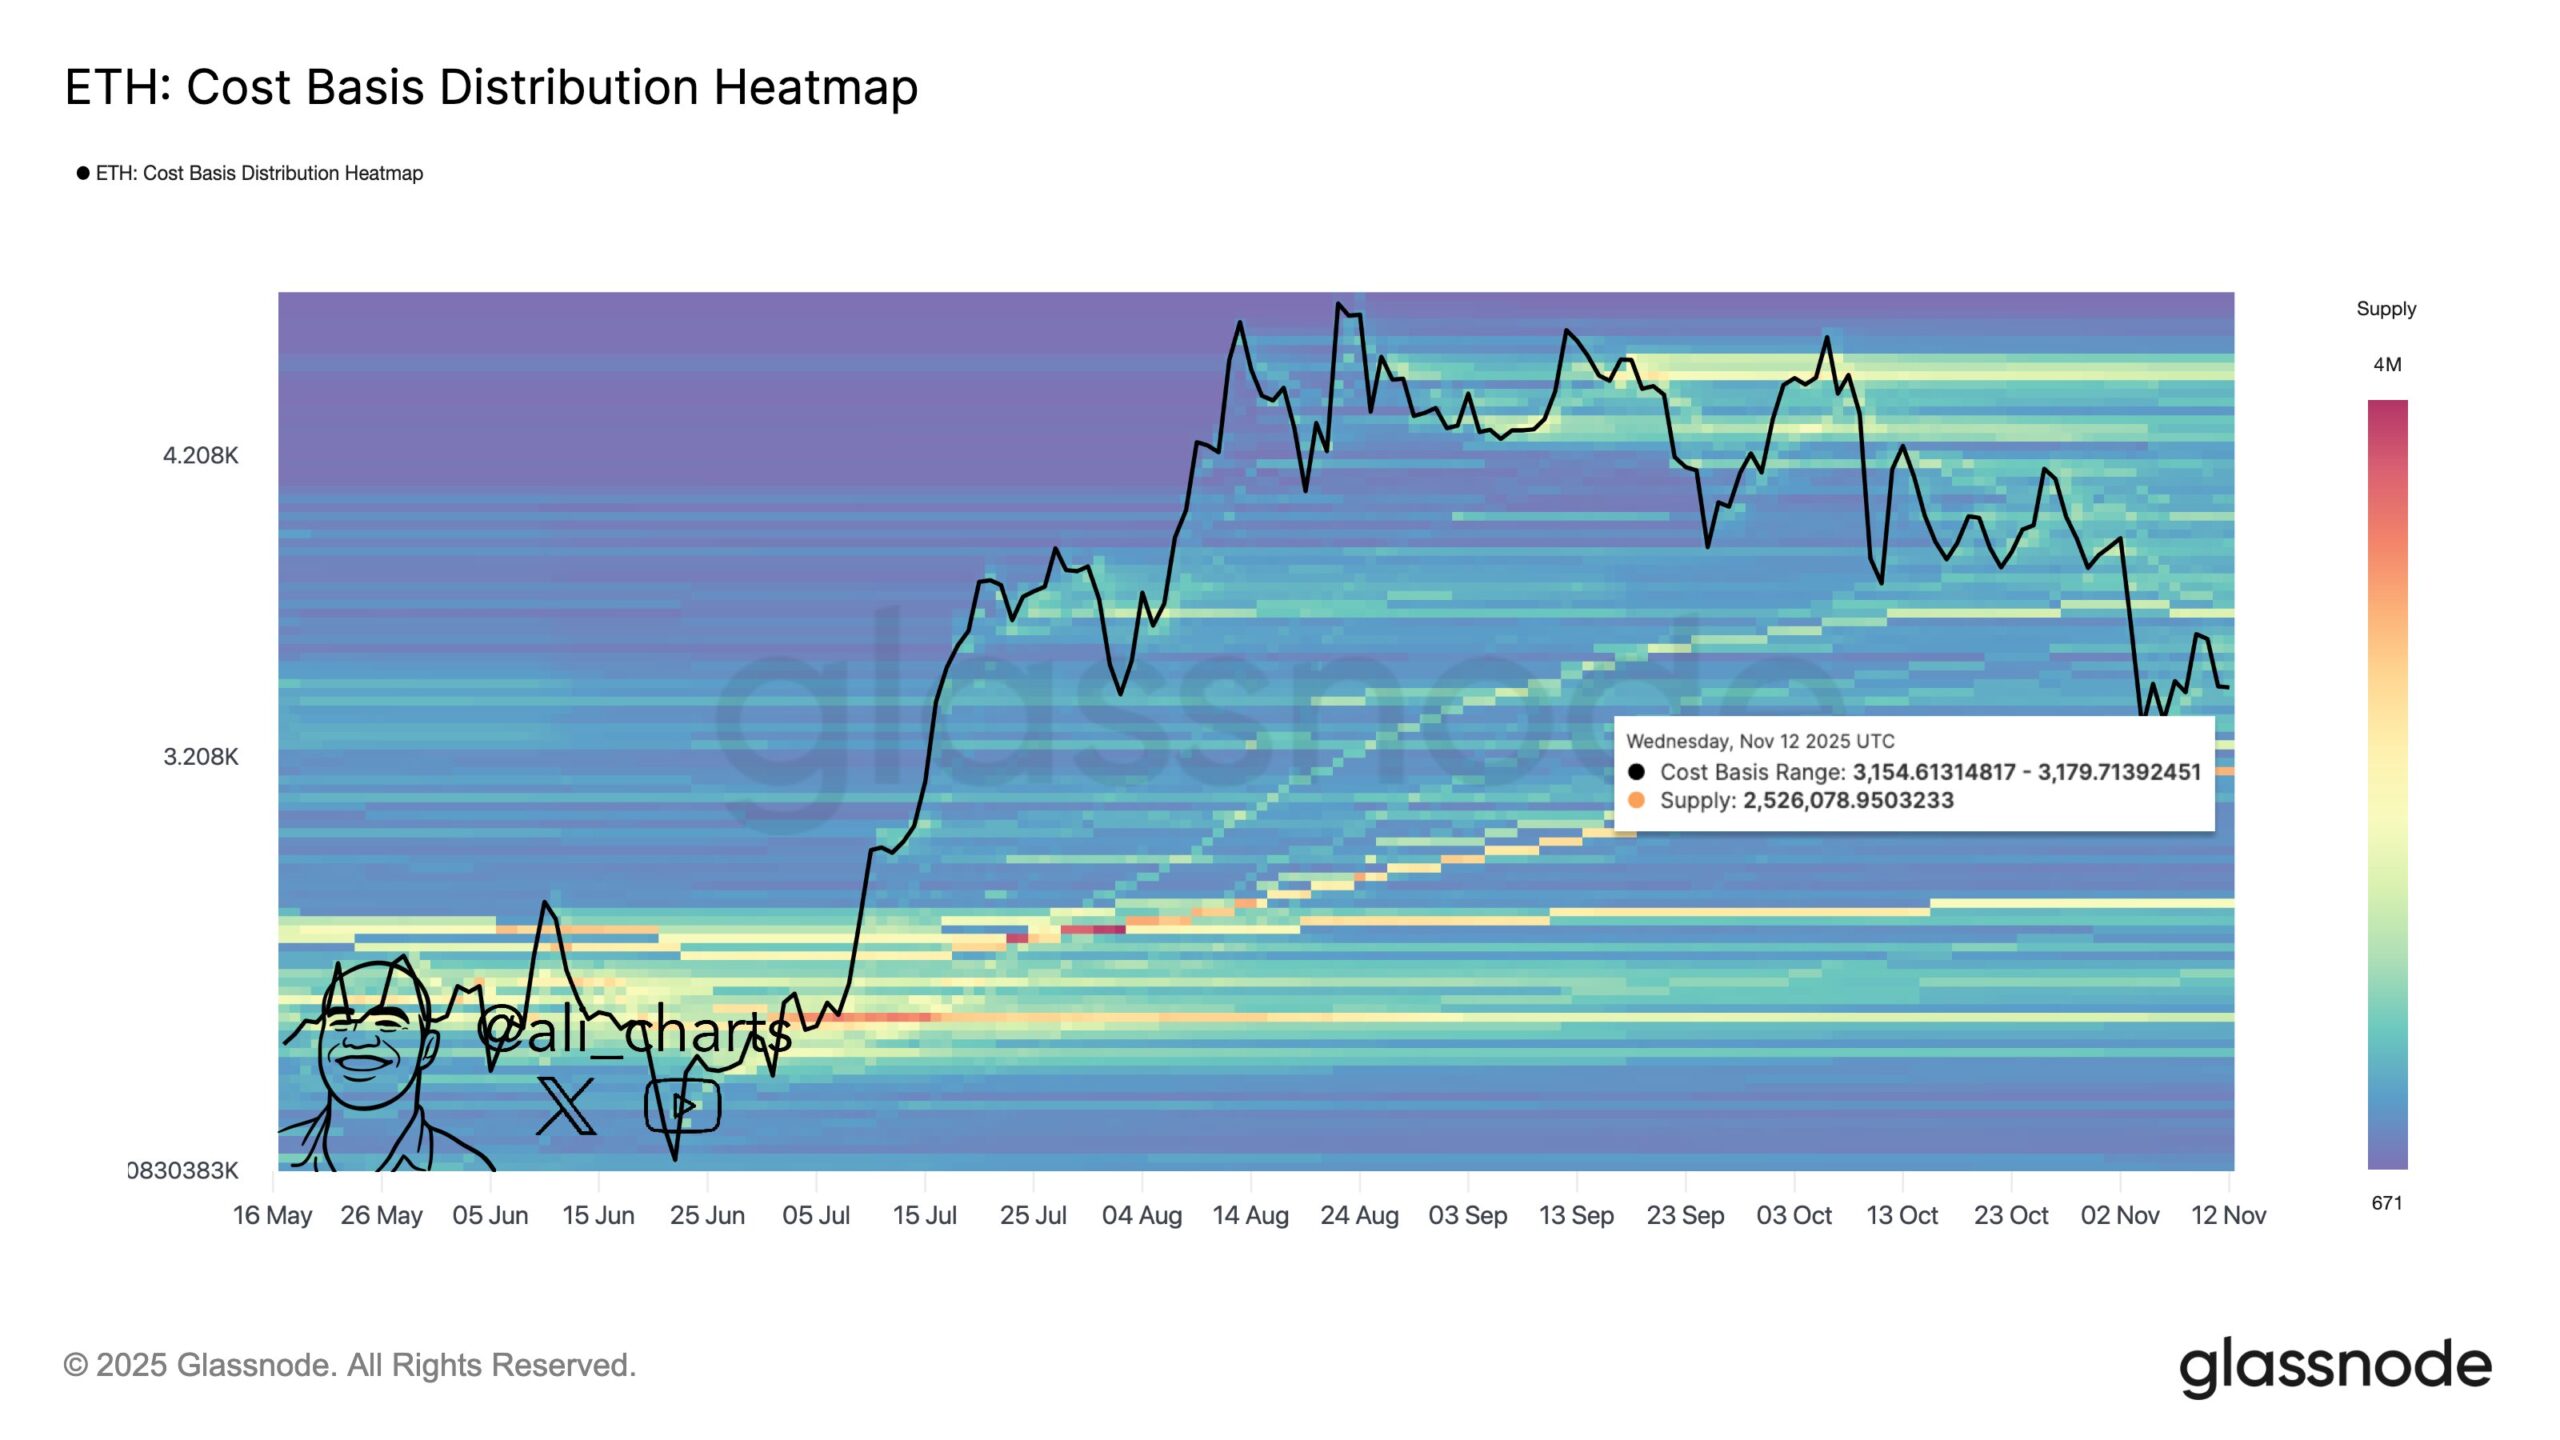
A large cluster of buyers accumulated 2.53 million ETH around $3,150, and this zone forms a rare support layer with significant on-chain weight. The heatmap highlights this level as a major accumulation shelf, and it explains why the region now attracts intense attention. Many holders built positions at this point, and that concentration signals strong conviction during earlier corrections.
Moreover, the pullback pushes price toward this cluster again, and this interaction often shapes the next phase of the trend. The formation also aligns with the idea that ETH stabilizes near heavy cost-basis layers before forming stronger moves.
Meanwhile, the path toward this zone follows a clean structure that supports one last sweep toward $3,000 before buyers gain clear control. Therefore, the $3,150 region stands as the most important near-term anchor, and its strength often sets up the next wave.

To sum up, Ethereum price trades near a zone that carries heavy weight during deep corrections, and this placement still offers a clean setup for its next phase. ETH may slip toward $3,000 since sellers guide short-term movement.
However, the dense $3,150 accumulation cluster gives buyers a strong base and improves recovery potential. Therefore, dip buyers gain a favorable window here, and ETH holds a realistic path toward a rebound that could stretch toward the $5,000 region once the market stabilizes.