The Ethereum price now trades inside a zone that shaped important turning points in earlier cycles. Liquidity reset signals show the same sharp drop that preceded strong recoveries. ETH moves inside a tightening structure as both sides react near familiar levels. Market depth thins again and forces price to behave more aggressively during each swing. This creates a setup where direction forms quickly once liquidity begins to rebuild from the lower boundary.
Ethereum Price Liquidity Reset Shows Strong Parallels to Earlier Cycle Floors
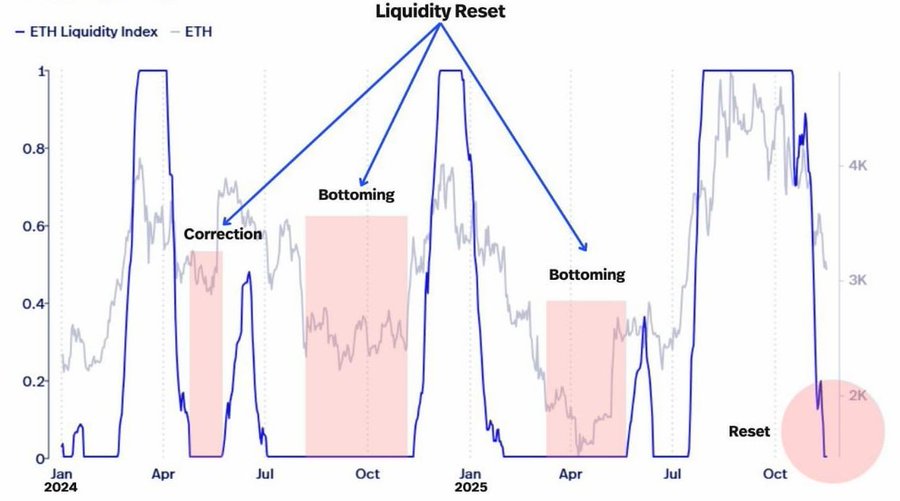
Liquidity data now signals a full reset that mirrors earlier historical bottom zones with striking accuracy. Each previous drop in liquidity produced strong reactions once depth began improving again.
The ETH market value trades near $3,019 while the market absorbs this fresh reset stage. ETH now moves around zones that triggered major reversals earlier in the year, and this draws renewed interest from buyers. Many participants responded quickly at these same reset pockets in past cycles, and similar behavior may appear here as well.
The Ethereum price now interacts with levels where thinning depth forces sharper compression across the chart. This compression narrows movement and increases the probability of strong direction once depth returns.
Reset pockets rarely remain quiet for long because participants act quickly after the market displays early rebuilding signs. The latest reset places ETH at a familiar technical floor where decisive activity often emerges without delay.
Traders respond to this environment because earlier cycles displayed clear shifts from identical structures. These parallels give the market a strong reason to pay attention as ETH approaches another possible turning phase.

Descending Wedge Forms a Tight and Clear Technical Roadmap
The chart shows ETH trading inside a descending wedge that has guided price action for several weeks. The ETH price touches the wedge floor near $2,930 and reacts with steady buy-side strength during each test.
Sellers continue to defend the declining upper boundary, and the space between both lines keeps shrinking with every swing. This tightening pattern increases pressure inside the wedge and reduces space for sideways movement. Immediate resistance sits at $3,206, while a stronger barrier stands at $3,607, and ETH must clear both before buyers gain broader control.
The Ethereum price forms a cleaner roadmap because wedge structures often break once the boundaries compress tightly. The MFI now sits near mid-range and shows stable inflow strength rather than exhaustion or weakness. This position encourages a potential breakout attempt if ETH lifts above the descending trendline.
The long-term ETH price outlook improves quickly once candle bodies close above the wedge ceiling because the path opens toward $4,244. A successful breakout gives ETH enough room to target $4,800 as the chart regains a healthier structure and stronger upward rhythm.
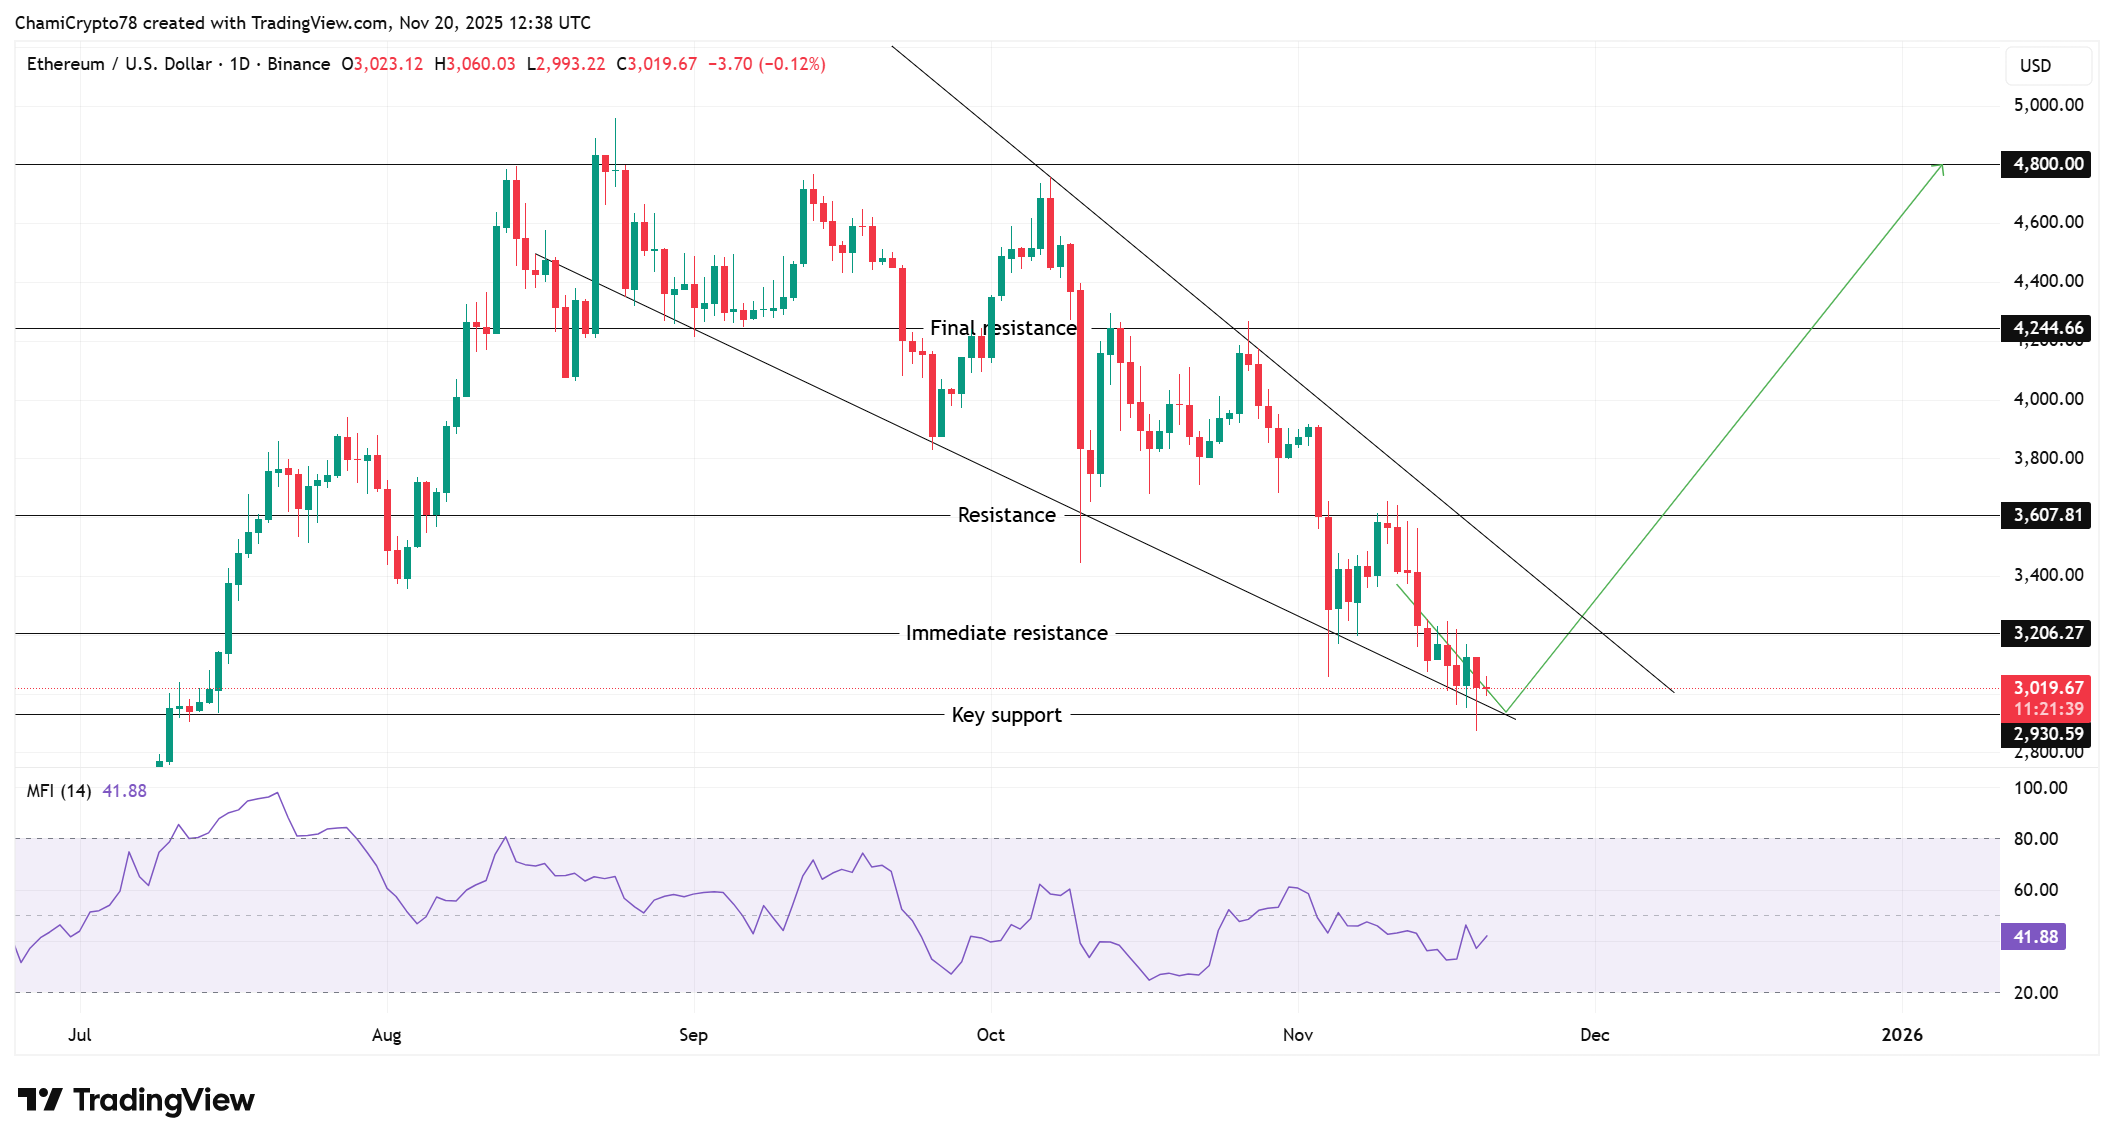

To sum up, the Ethereum price now trades near a zone that shapes direction quickly. ETH respects the wedge floor while approaching a point where compression forces a stronger move. A clean break above $3,206 opens the road toward the mid-range area at $3,607, and eventually $4800. Failure to break the upper wedge wall keeps ETH near support and delays any stronger recovery phase.
Source: https://coingape.com/markets/ethereum-price-hits-historical-liquidity-reset-is-a-bounce-coming/