- Ethereum surges over 25% with significant trading volume and market dominance.
- Bitcoin remains dominant with steady gains and notable volume.
- Pepe’s price rises sharply, reflecting increased investor interest.
Ethereum surges past $2,100, ending prolonged consolidation and marking a key structural breakthrough, while Bitcoin continues its uptrend above $99,475, eyeing its all-time highs. PEPE stages a significant reversal, pushing into a higher range.
Ethereum’s breakout, characterized by a massive bullish Marubozu and high volume, suggests institutional involvement. Bitcoin’s strength is reinforced by a bullish Ichimoku cloud and stable volume. PEPE’s rapid ascent signals potential trend continuation or near-term consolidation.
Ethereum Hits High with 25.54% Jump
Ethereum surged 25.54% in 24 hours, reaching $2,432.48. Trading volume soared to $42,197,991,218, with market cap at $293,676,601,011. Dominance stands at 8.93%, reflecting a 33.24% weekly gain.
Ethereum (ETH) Technical Analysis
Ethereum has broken decisively out of a prolonged accumulation zone between ~$1,500 and ~$1,900, where it had been consolidating for months. The current breakout represents a major shift in market structure, pushing ETH out of its previous lower-high pattern into a new uptrend.
The breakout above $2,100 was clean and powerful, reclaiming a key structural resistance level and flipping it into potential support.
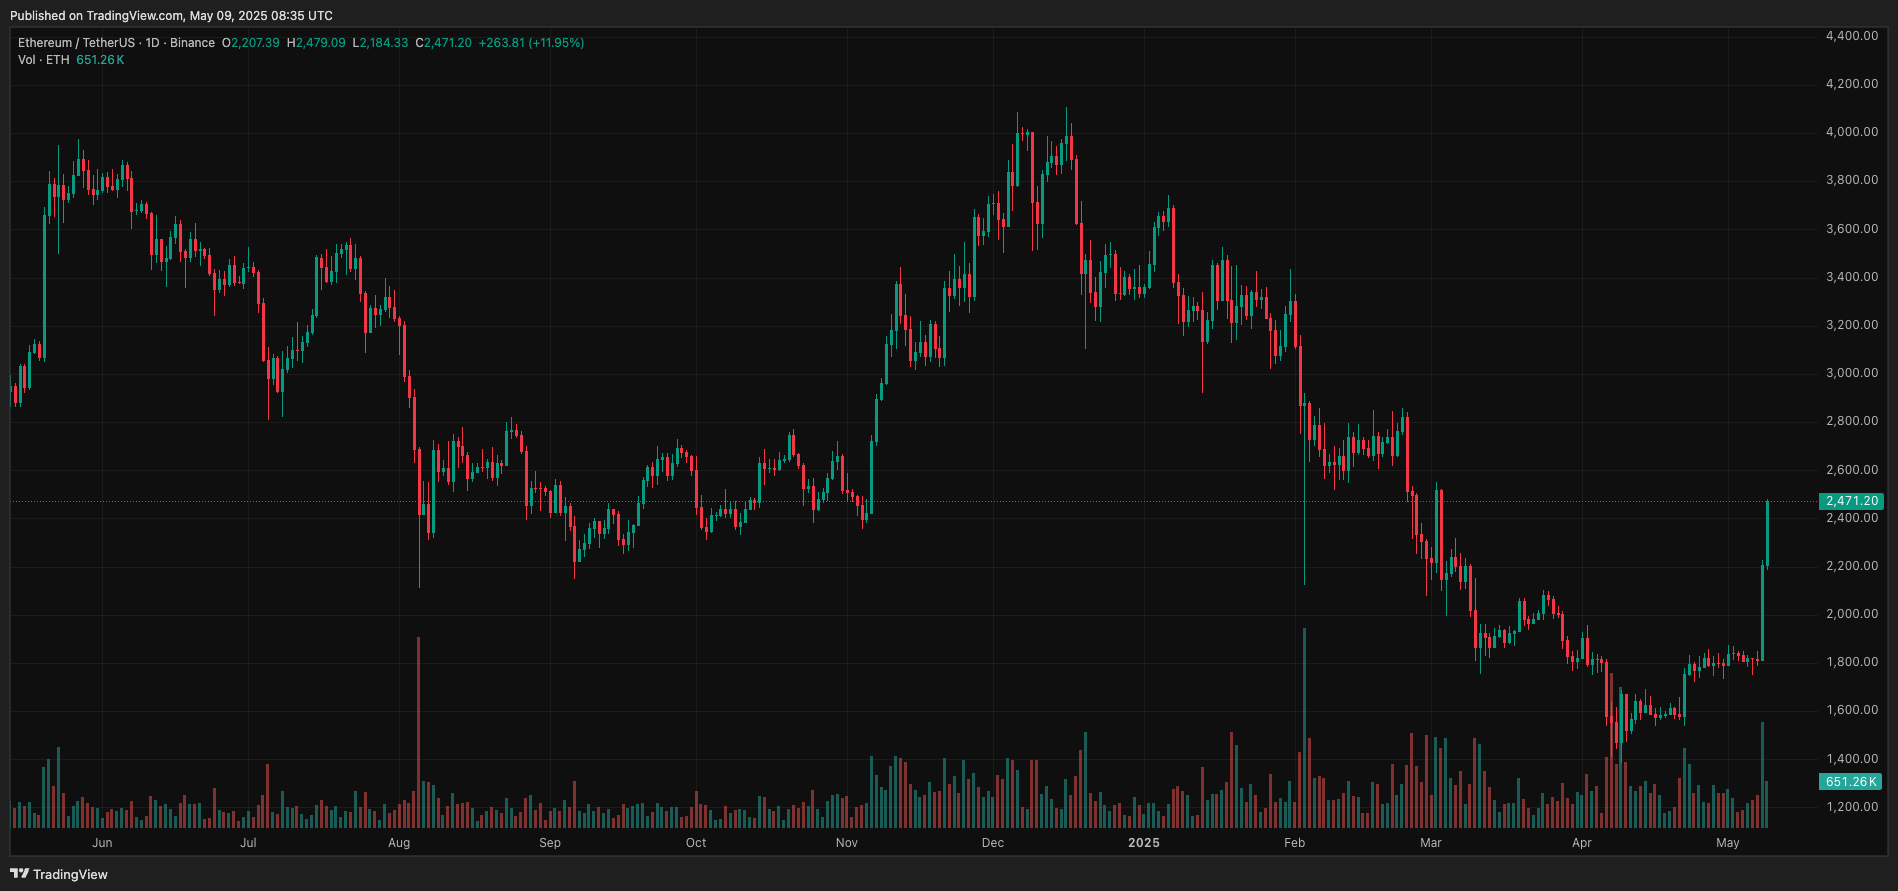

The most recent daily candle is a large bullish Marubozu (little to no wick), closing near its high, with a gain of over 12%. This candle is paired with the highest volume seen in months, signaling strong buyer conviction and possibly institutional activity.
The absence of upper shadows indicates minimal selling pressure, while the follow-through candle confirms trend momentum. The breakout is clean and backed by volume—hallmarks of a legitimate trend reversal or continuation.
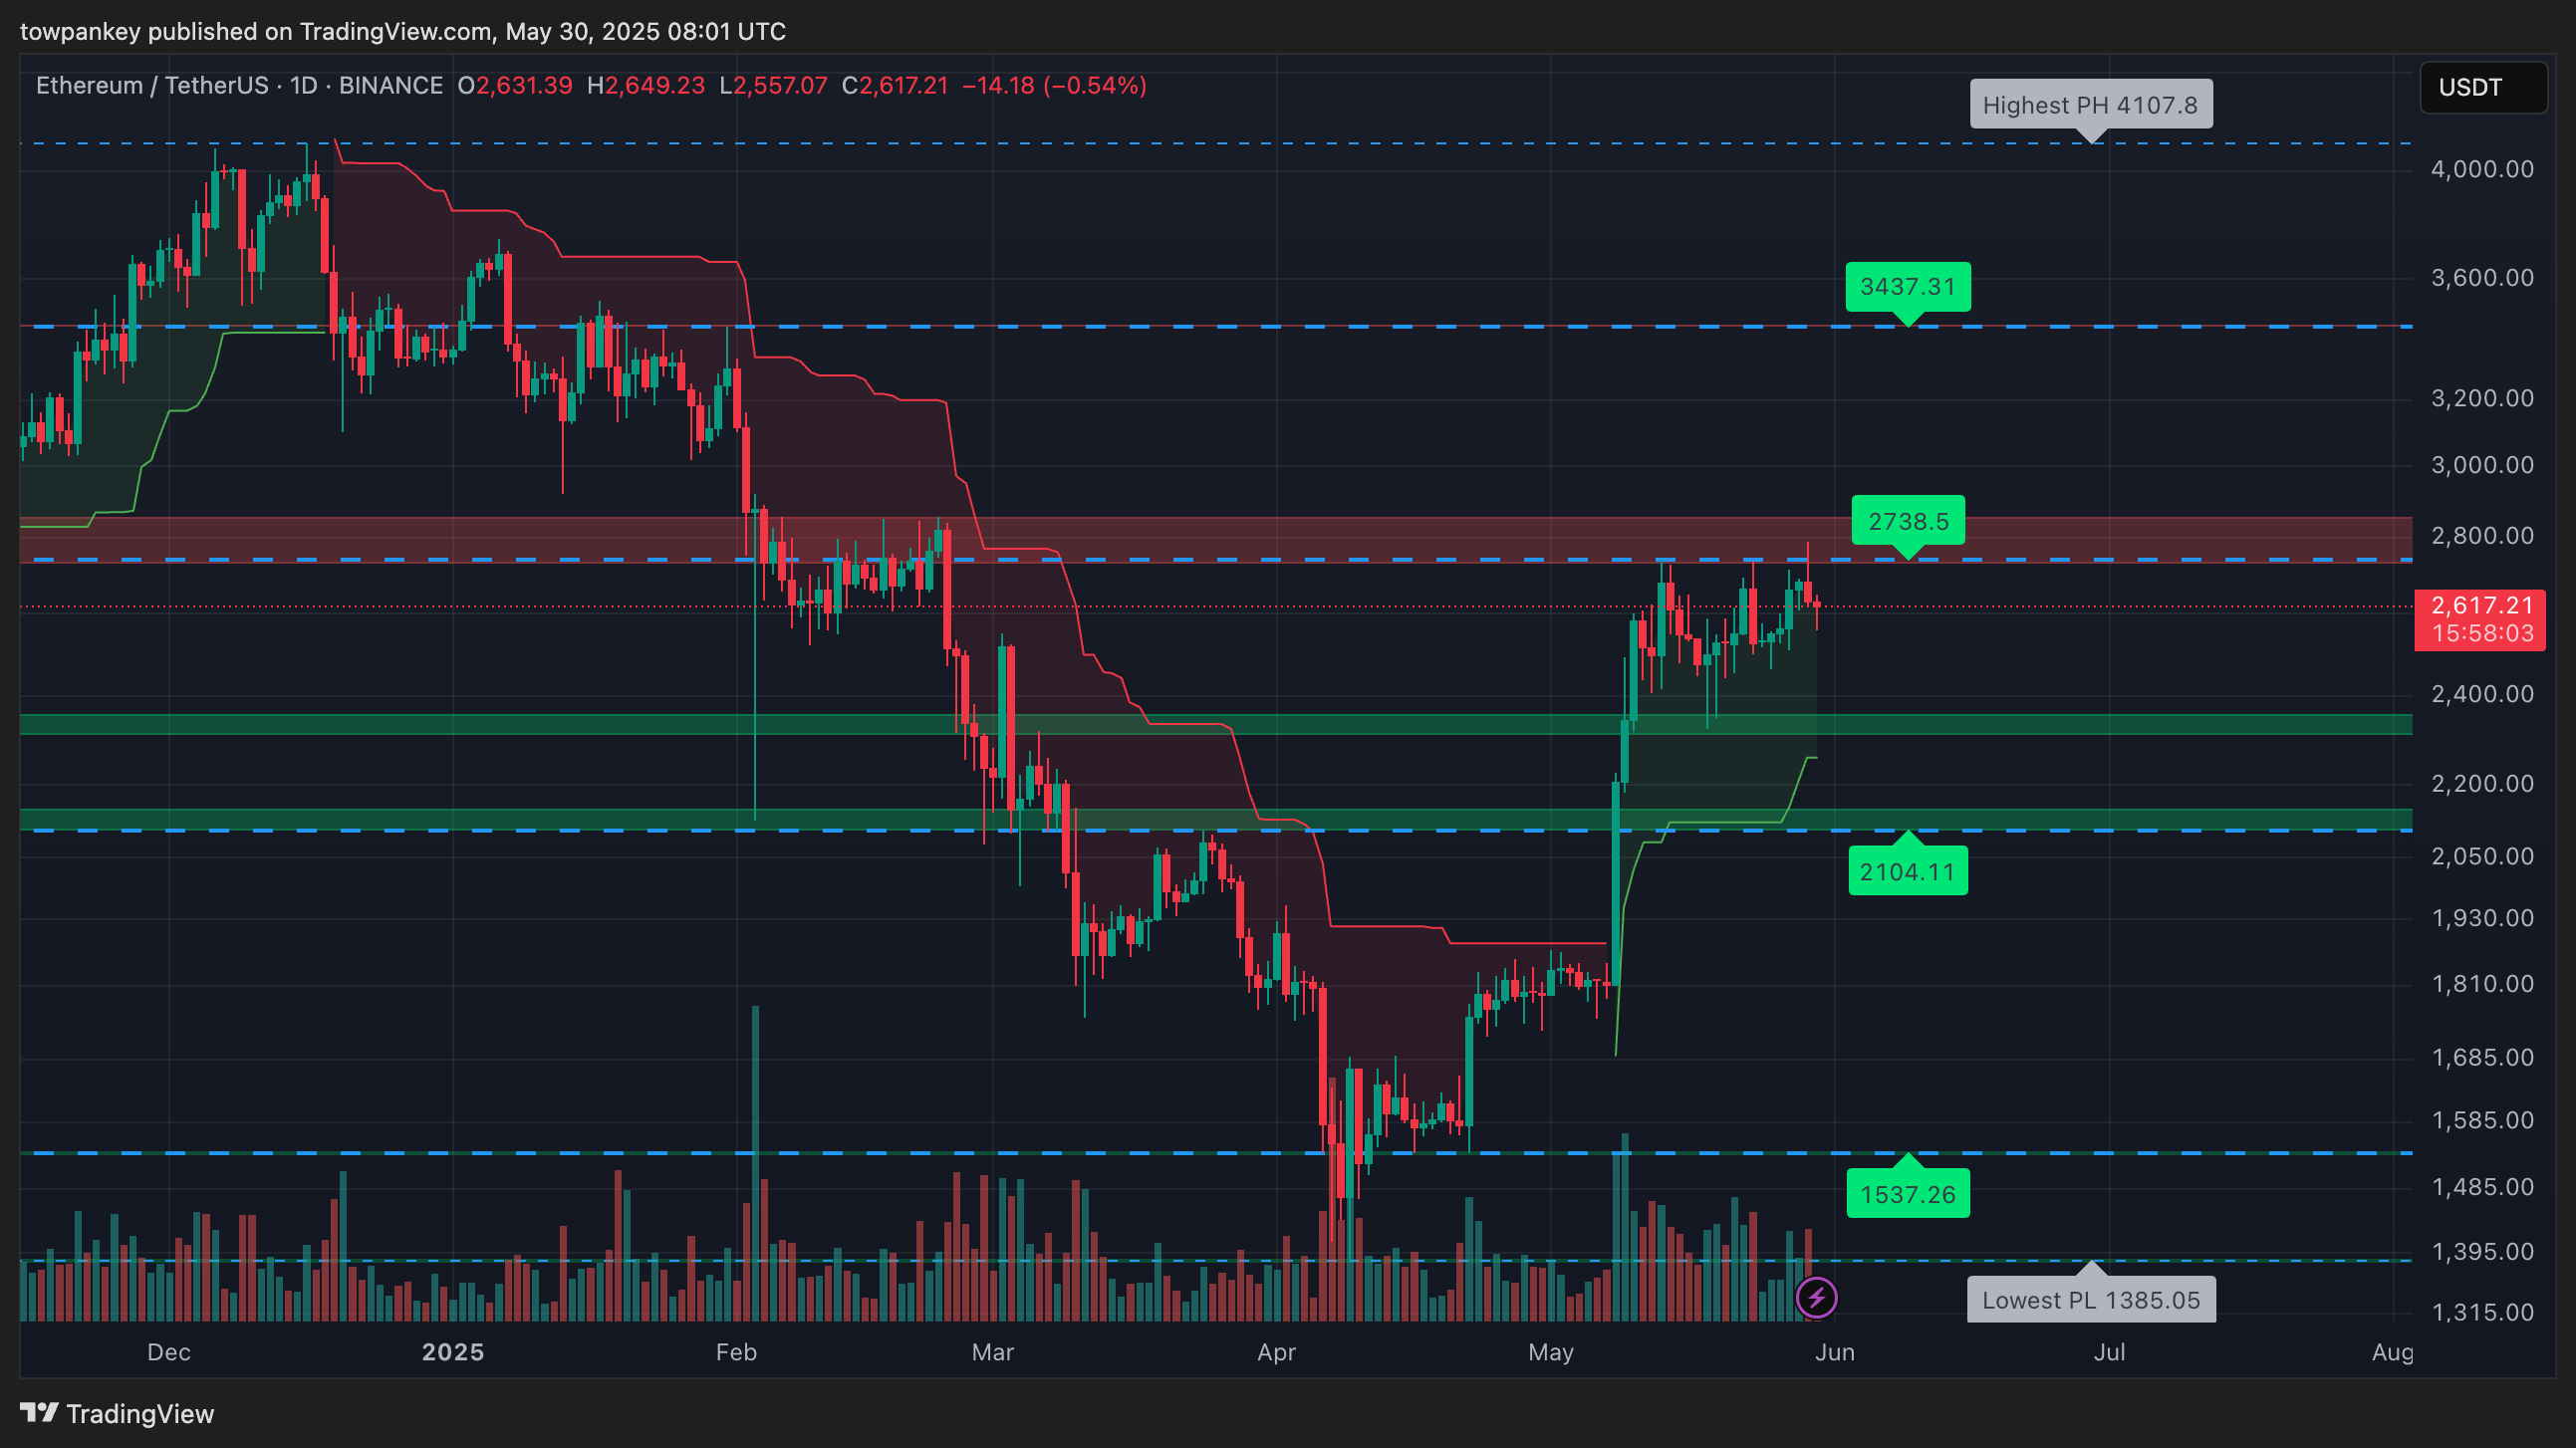

Ethereum Price Action Scenarios
- Bullish: If price breaks above $2,500 (local consolidation zone), ETH may rally toward $2,857 and $3,437—key resistance zones marked from past structure.
- Bearish:If price falls back below $2,100 support, a retest of the $1,860 and potentially $1,537 levels could follow.
- Neutral: Sideways movement likely if ETH ranges between $2,250–$2,500 while volume decreases near the top of the breakout candle.
Read more: Ethereum (ETH) Price Prediction Tomorrow and Next Week
Bitcoin Gains 3.25%, Maintains Strong Volume
Bitcoin (BTC) emerges as today’s trending altcoin with a 24h change of 3.25% at $102,877.51. Its trading volume of $69,837,104,020 highlights dominance at 62.01%, marking a positive weekly gain of 6.31%.
BTC’s RSI is 81.05 indicating bearish sentiment. MACD bears at 3,640.46, while ADX is neutral at 23.32. MFI neutral at 68.02, with potential support eyed alongside SMA alignment.
Bitcoin (BTC) Technical Analysis
Bitcoin has decisively broken above a key resistance zone around $99,475, marking a continuation of the broader uptrend that started in late 2024. This breakout confirms bullish dominance after a multi-month consolidation range between ~$88,000 and ~$99,000.
Price is now moving toward the all-time high (ATH) region near $109,588, suggesting a possible retest or breakout attempt.
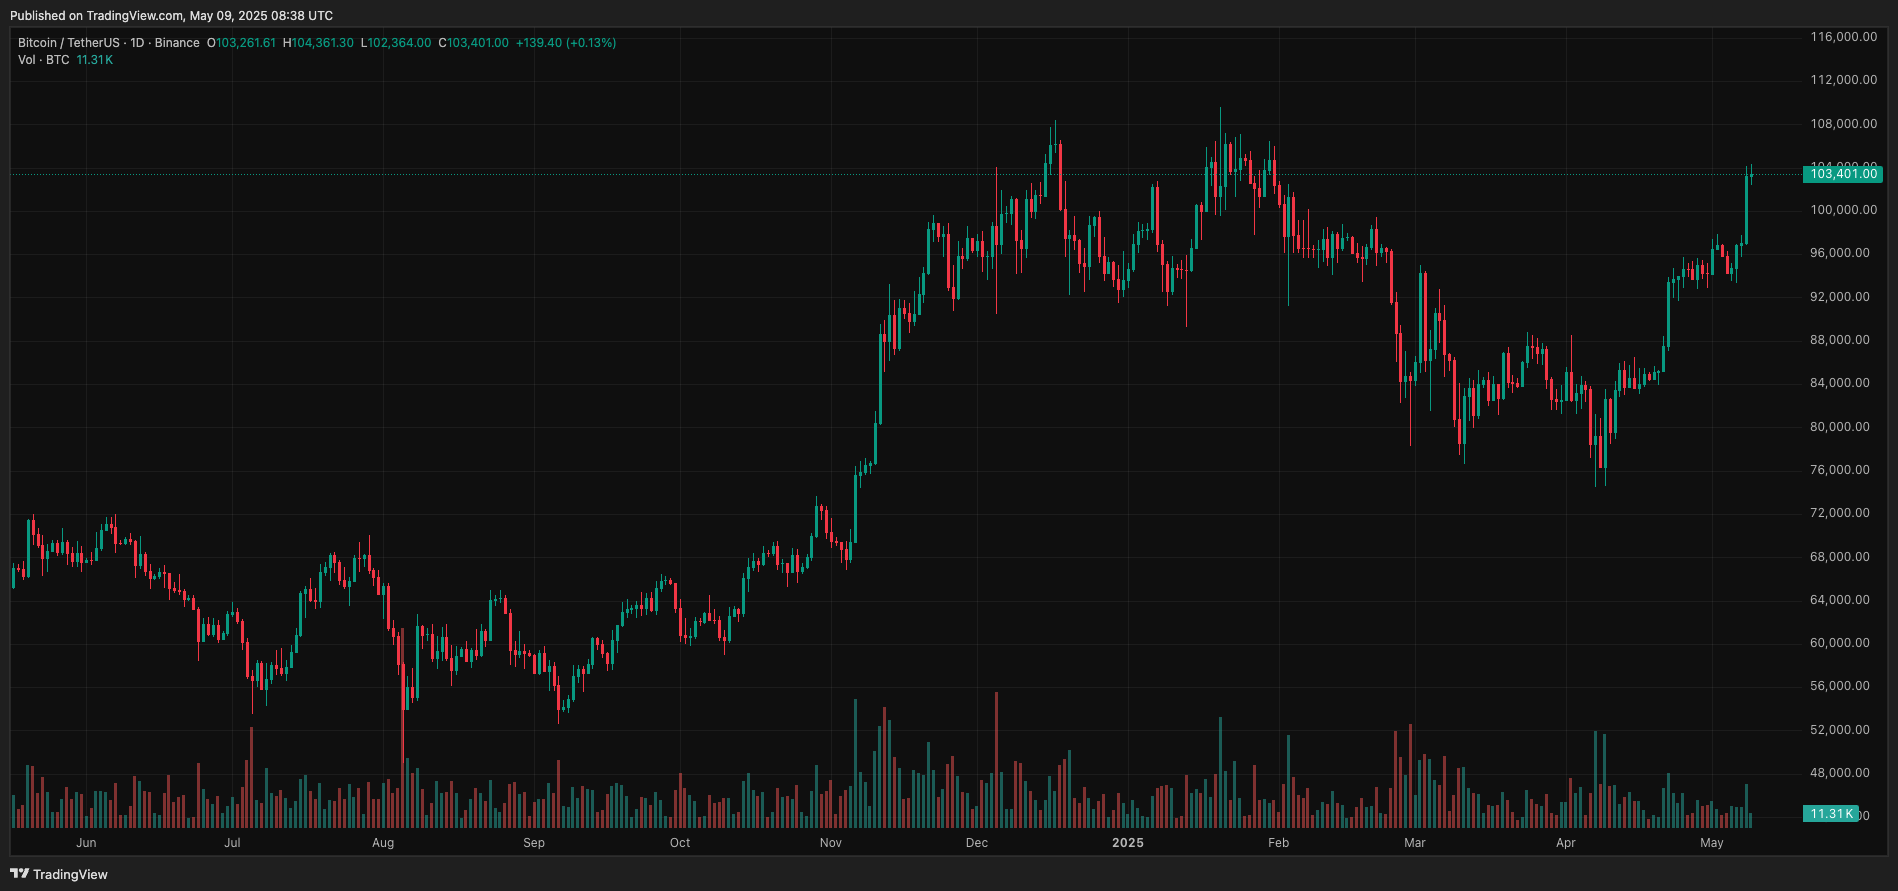

The breakout candle is a strong green candle closing near its high, with relatively expanded volume. The absence of significant upper wicks indicates persistent buying pressure.
The Ichimoku cloud has flipped bullish, and price is now trading well above it, confirming trend strength. The volume rise during the breakout from the resistance band suggests conviction from market participants, reducing the likelihood of a false breakout.
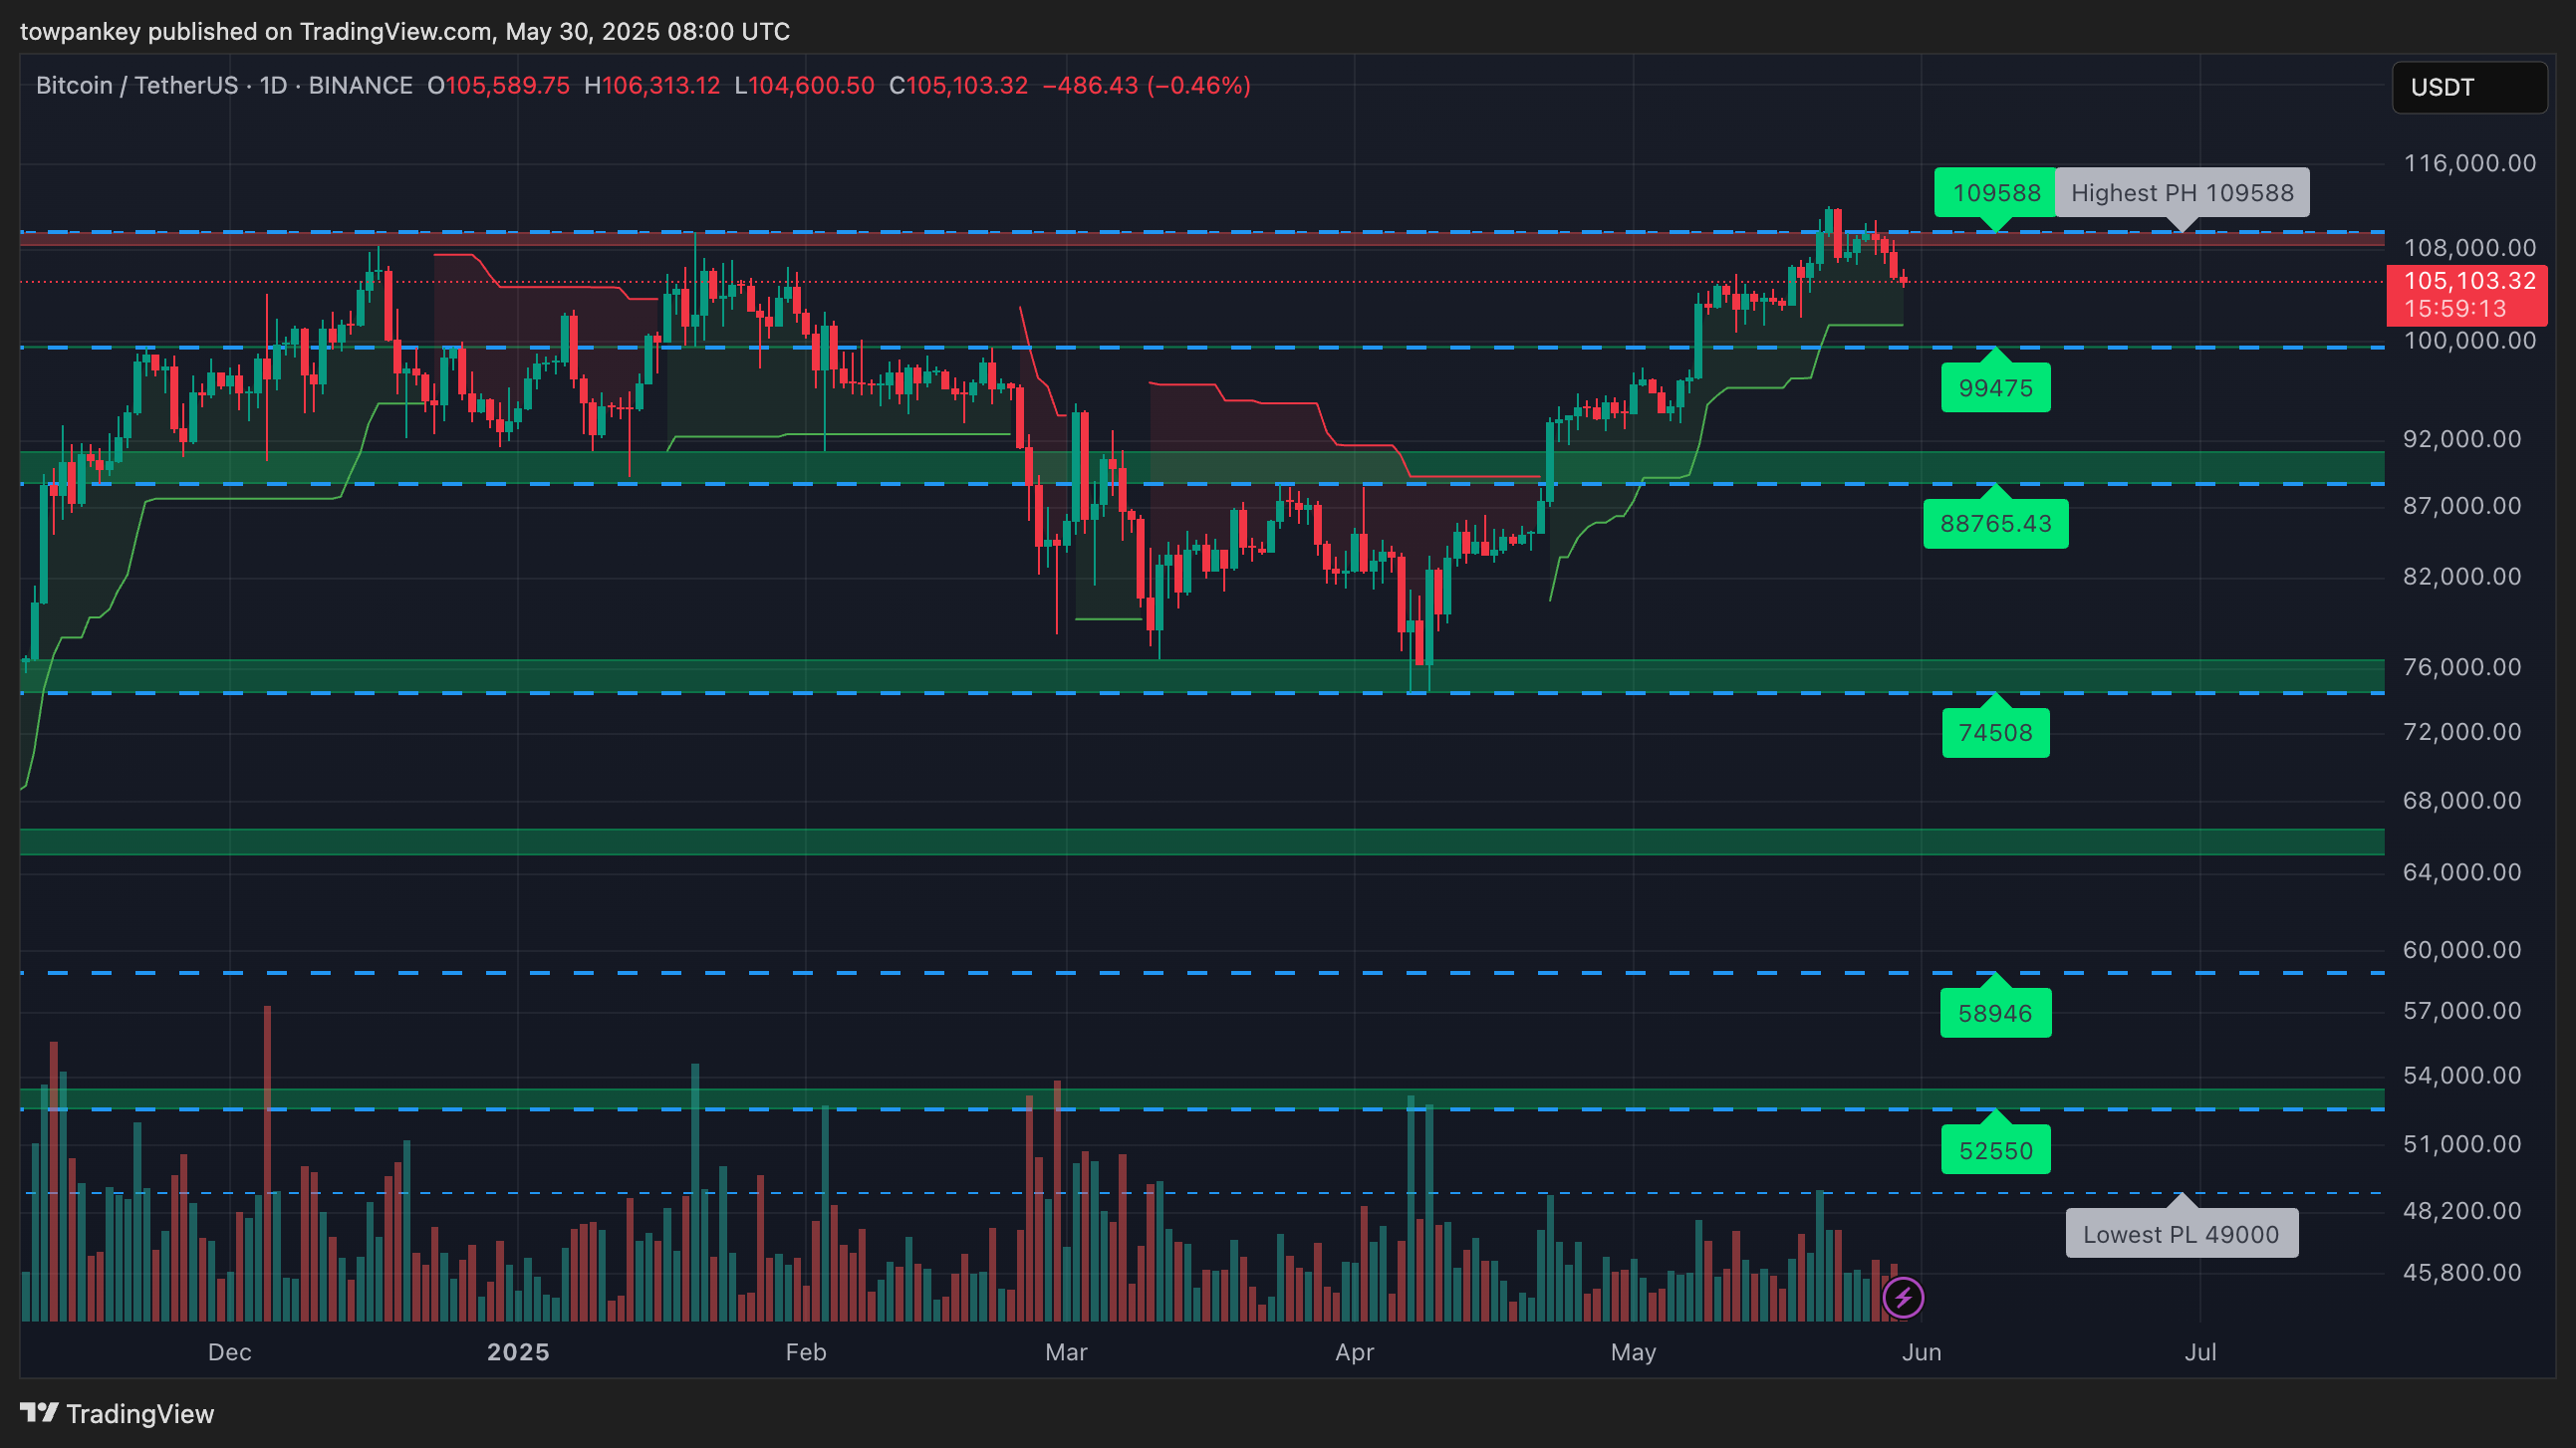

Bitcoin Price Action Scenarios
- Bullish: If BTC holds above $99,475, it could push toward ATH at $109,588, possibly even attempting new highs.
- Bearish:A drop below $99,475 with strong sell volume may signal a failed breakout, leading to a revisit of the $88,765 level.
- Neutral: If BTC consolidates between $99,000–$104,000 with shrinking volume, a short-term range may develop.
Read more: Bitcoin (BTC) Price Prediction Tomorrow and Next Week
Pepe Increases 43.49%, Signals Investor Interest
Pepe (PEPE) is gaining traction with a 24-hour price gain of 43.49%, trading at $0.00. Its trading volume surged 327.35% to $2,995,331,987, indicating bullish momentum. Recent market performance shows a weekly increase of 51.28%. The MACD value signals potential upside continuation.
Technical analysis shows RSI at 82.74, indicating overbought territory, while ADX at 15.90 suggests moderate trend strength. With SMA alignment favoring bullish trends, the StochRSI sits at 45.52, highlighting buying pressure amidst signs of potential trend exhaustion.
Read more: Pepe (PEPE) Price Prediction Tomorrow and Next Week
Pepe (PEPE) Technical Analysis
PEPE has confirmed a major reversal from its downtrend, completing a bullish breakout from the previous lower-high structure.
After basing above the strong support zone around 0.00000571, price exploded past prior resistance at 0.00000981 and is now pushing into a higher consolidation range. This marks a significant change in character (CHOCH), establishing a potential uptrend with higher targets.
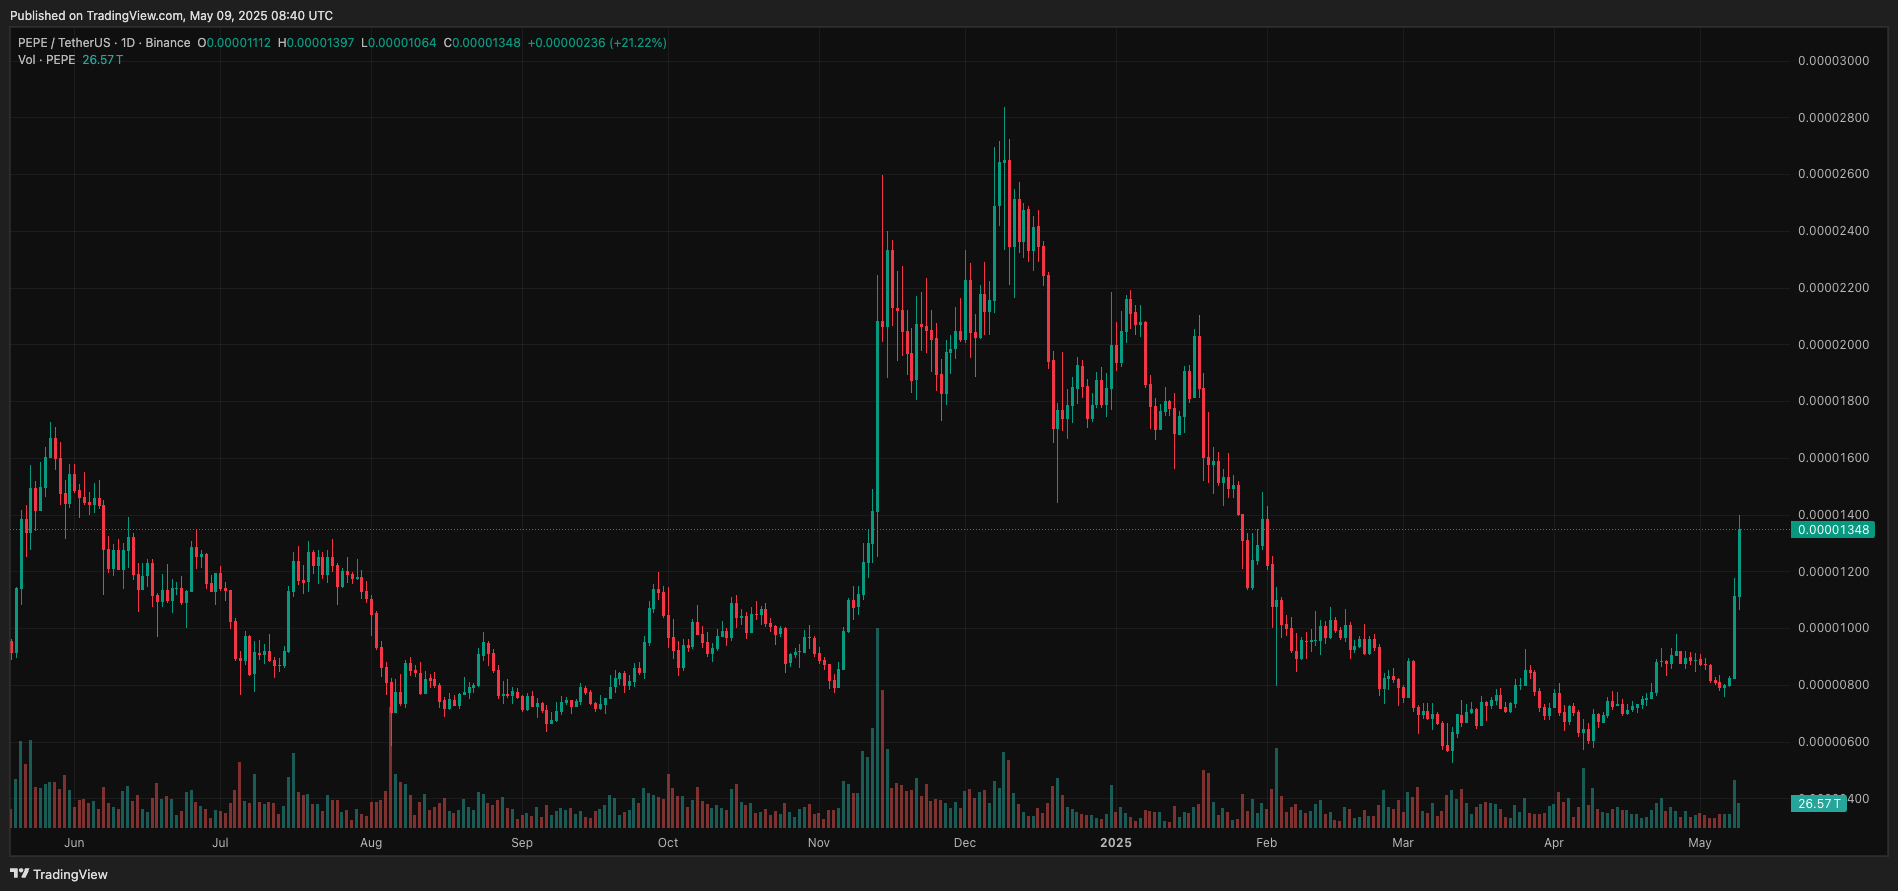

Today’s candle shows a vertical breakout with a 19.42% gain and high bullish momentum, confirmed by a notable surge in volume—the highest in recent months. The strong body with minimal wick at the top suggests decisive buyer control.
Such a type of price expansion following a long accumulation often leads to either continuation or short-term cooling before another leg up.

Pepe Price Action Scenarios
- Bullish: If price sustains above 0.00001250, a move to 0.00001441 is likely, with a possible extension toward 0.00002103.
- Bearish:If price drops below 0.00000981, expect a pullback to 0.00000770 or even 0.00000571 for liquidity grab.
- Neutral: Sideways chop probable if price ranges between 0.00001200–0.00001350 with flat volume.
| DISCLAIMER: The information on this website is provided as general market commentary and does not constitute investment advice. We encourage you to do your own research before investing. |
Source: https://coincu.com/336605-ethereum-bitcoin-pepe-price-trends/